Figures & data
Table 1. Elementary analysis in weight percentage (wt. %) for nonprecious alloys (CoCr), CopraBond K, Cara SLM, Kera-disc, Remanium 2001, Wirobond SG and Wirobond 280.
Table 2. Precious alloys, d.SIGN 53, Argelite 61, Precious 1 and Precious 2.
Figure 1. Number of base-metal crowns sorted in categories according to degree of deviation (A: all base metals, B: Predominantly base metal base metal only C: noble metal base metal only.) No deviation: Minor deviations in major constituents (elements that comprises >20 wt. %) and slight deviations in additional elements that comprise <10 wt.%. Small deviation: <5 wt. % concerning major constituents and/or deviations >1 wt. % in additional elements that comprise <10 wt.%. Large deviation: >5wt. % concerning major constituents and missing and/or additional elements.
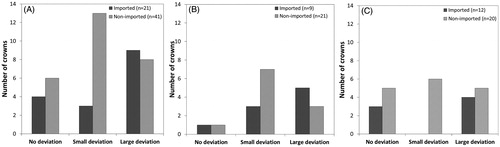
Figure 2. Whisker diagrams depicting distribution of data concerning alloy content deviation. Alloys ‘Noble’ (D) had large variations, hence the outliers in several of the constituents, whereas d.SIGN53 (B) showed little variation. *Noble metal diagram includes both Noble metal 1 and 2; these two alloys are both from Lab D and were termed Noble metal, however with slight differences in wt. % of each element. #statistically significant difference between the mean of the sampled population and the hypothesized population mean (p < .05).
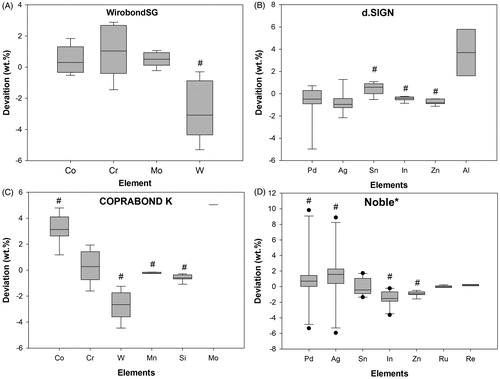
Table 3. Distribution and number of base-metal crowns sorted in categories according to degree of deviation.
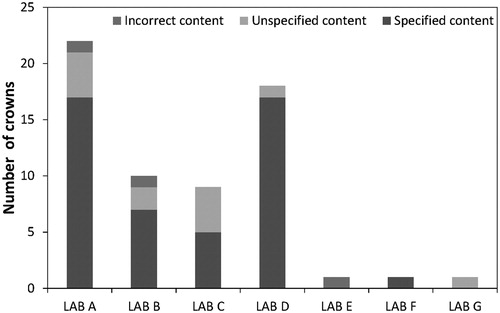
Figure 3. Information provided by the seven different dental laboratories showing level of ‘incorrect content’, ‘unspecified content’ and ‘specified content’.