Figures & data
Table 1. Comparison of investigated alloys, their compositions and recommended heat treatment specifications.
Figure 1. The dynamic corrosion test set-up. A specimen was placed on supporting pins immersed in artificial saliva (corrosive solution, pH= 2.3). The inner chamber, the bending bar and the supporting pins comprise of polyoxymethylene (POM) thermoplastic material. The inner chamber was sealed to prevent evaporation of the corrosive solution. The outer chamber was filled with distilled water set to constant temperature of 37 °C.
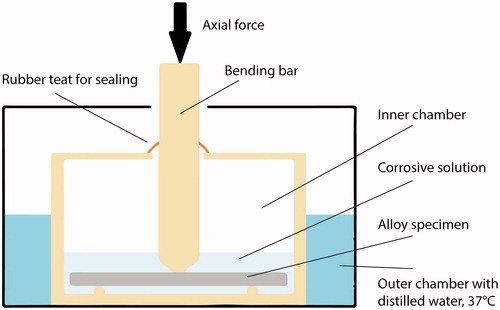
Figure 2. Load, displacement (y-axis) and time (x-axis) during cyclic loading of an alloy specimen. The green line shows force (N) applied to a specimen and the blue line shows the corresponding displacement as the alloy deflects. Each minima peak presents the highest values in force and displacement as a result from downward direction. Notice the highest force applied at the last cycle in a series.
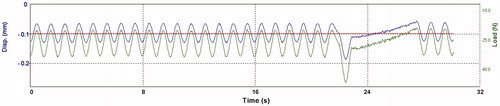
Table 2. Summary of selected compounds for cytotoxicity testing.
Table 3. Results from the static and dynamic corrosion immersion test analysed by ICP-MS. Mean values (of n = 3) are shown (µg released/cm2)±SD (except “#” where ± refers to max/min values; n = 2).
Figure 3. MTT-test results from the metal elements representing the Pd–Ag alloy (Aurolite© 2B) (n = 3, error bars indicate SD). *Statistical difference (p < .05).
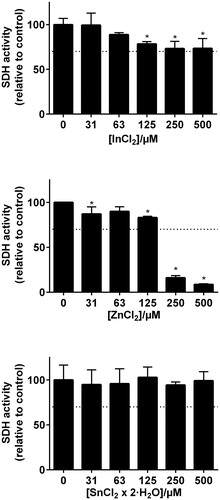
Figure 4. MTT-test results from the metal elements representing the Co–Cr based alloys (Wirobond© 280 and d.Sign© 30) (n = 3, error bars indicate SD). *Statistical difference (p < .05).
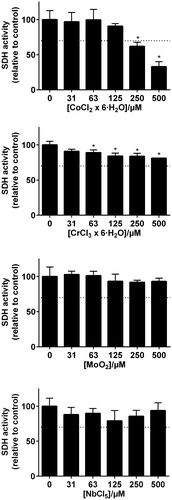
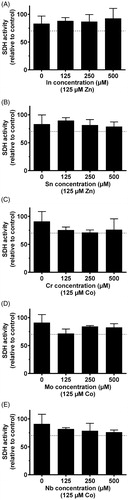
Figure 5. MTT-test results of elements combined. 125 µm Zn was combined with different concentration of In and Sn, representing the Pd–Ag alloy. For the Co–Cr alloys, 125 µm Co was combined with different concentrations of Cr, Mo and Nb.