
Figures & data
Table 1. The commercial composites used.
Figure 1. Representation of the process of scanning, designing and milling abutment models with different thicknesses used in this study.
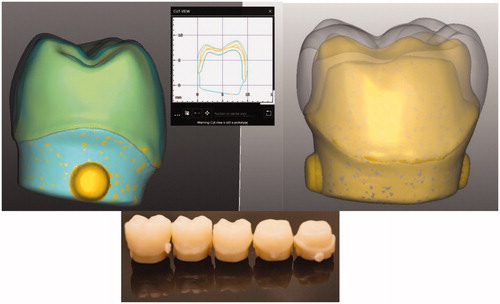
Figure 2. Schematic drawing of a bilayered core-crown restoration and the compression load test setup.
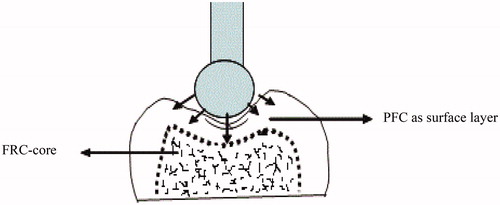
Figure 3. Linear regression (n = 48) between different thicknesses of the overlaying PFC and measured load-bearing capacity (N) of tested restorations.
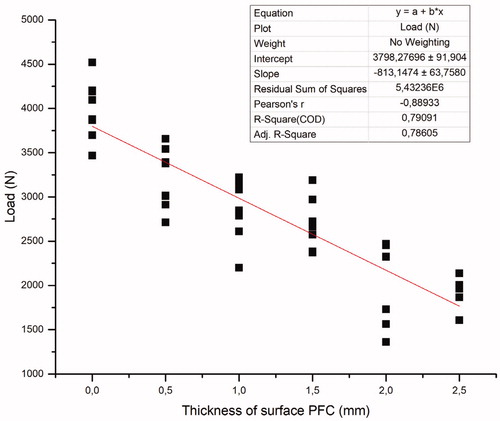
Figure 4. Percentage and photographs of various fracture patterns of the crown specimens. (A) Catastrophic crushing of particulate filler composite; (B) delamination of particulate filler composite from the fiber reinforced core; (C) cracking fracture in plain fiber reinforced composite.
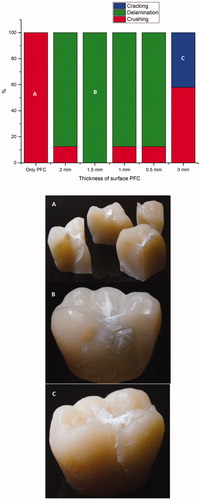
Table 2. Mean fracture load values (N) and standard deviations (SD) of tested restorations with different surface PFC thicknesses.