Figures & data
Figure 1. (a) Setup for the micro-CT analyses of the CPR compules (left), and the non-manipulated composite and the dental restoration (right) as seen in the micro-CT scanning software. The compule and the non-manipulated composite and dental restoration was scanned separately. The center volume include regions of the top and bottom volume. The extruded portion and the material placed in the typodonts were light-polymerised individually, but affixed together with wax before conducting the scans. (b) the CPR compules used in the study.
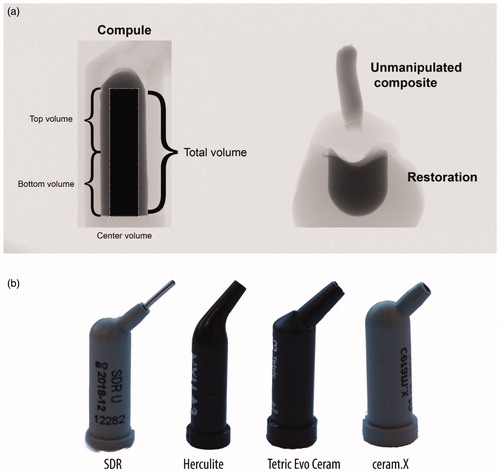
Figure 2. Boxplots of the amount of porosity (vol%) in the unpolymerised material in the compules (C) and in the dental restorations (R). Data shown are the average of 10 samples. Materials: SDR, Ceram.X Universal (CX), Herculite XRV Ultra (H), Tetric Evo Ceram (T).
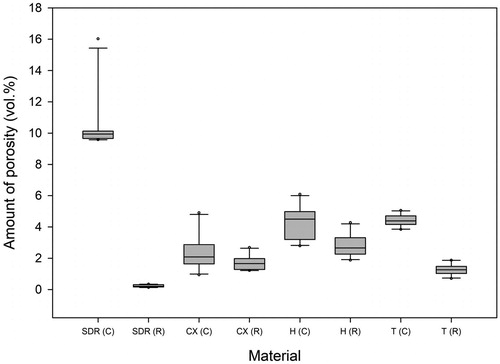
Table 1. Amount of porosity (vol%) in the unpolymerised material contained in the compule and the polymerized material in the dental restorations (averages of n = 10).
Figure 3. The amount of porosity (vol%) in the unpolymerised material in the top, centre and bottom parts of the compule (C) and in the polymerized material in the top, centre and bottom of the dental restorations (R). Data shown are the average of 10 dental restorations. Materials: SDR, Ceram.X Universal (CX), Herculite XRV Ultra (H), Tetric Evo Ceram (T). Data for SDR (C) omitted from the figure. Results for SDR (C): bottom: 20.4%; top: 0.3%; center: 20.1%.
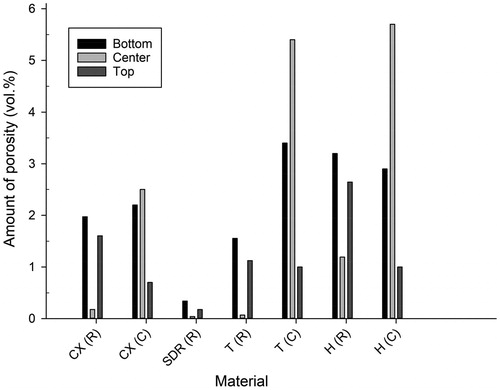
Figure 4. The relationship between the amount of porosity (vol%) in the unpolymerised material in the compule, the non-manipulated material and the dental restoration on a sample level (n = 10). The lines between data points are only shown for clarity and do not represent an assumed function between variables. Note that the upper limit of the Y-axis of flowable bulk-fill composite (SDR) is higher than the Y-axis of the universal composites (which are similar). There is no linear relationship between the amount of porosity in the compule and the amount of porosity in the dental restoration.
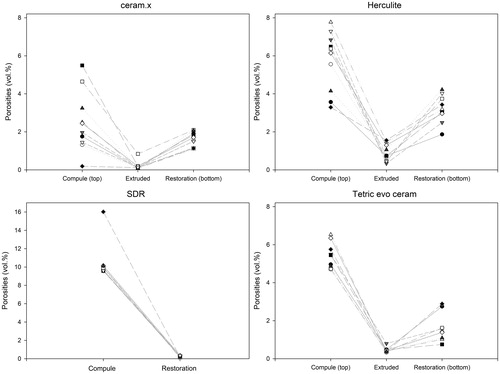
Figure 5. The pore size distributions in the unpolymerised material in the compules and in the polymerized material, respectively in the extruded portion from the compule tip and in the material used to restore the cavity in the typodont. The Y-axis is the percentage of pores within the stated range in micrometres (µm) described along the X-axis. The lines between data points are only shown for clarity and do not represent an assumed function between variables. Data shown are the average of 10 samples.
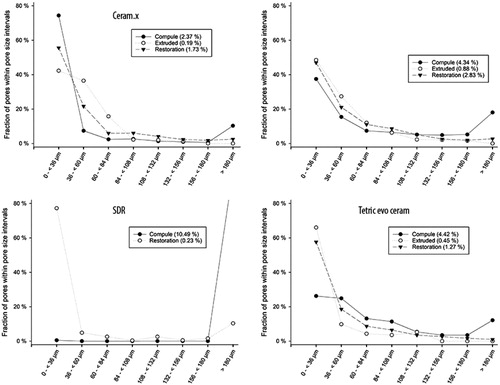
Figure 6. Examples of two outlier compules in the Ceram.X Universal group viewed in Dataviewer software (Bruker, Kontich, Belgium) from the coronal and sagittal view. Note the large pore/air bubble in the extrusion lumen of the compules (white arrow showing the border between material and lumen). Right images show a third compule of Ceram.X Universal with less than the average amount of porosity.
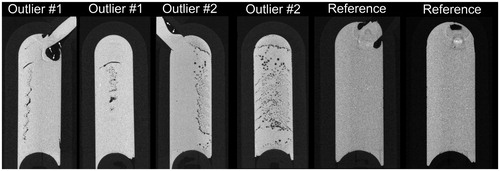
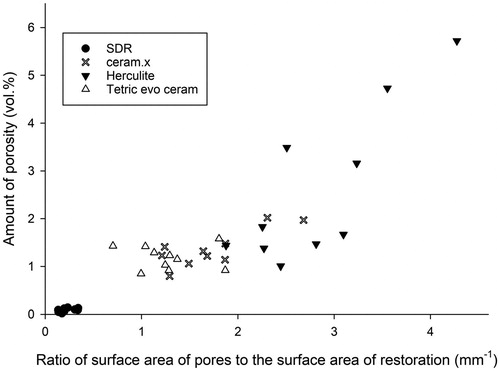
Figure 7. The relationship between the total amount of porosity (vol%) in restorations made with the four investigated materials and the accumulated surface area of all pores adjusted for the total volume of restoration analysed (n = 10 for all groups).