Figures & data
Table 1. Products and cementation procedures.
Figure 1. Schematic drawing of tooth and dentin specimens: axial cut giving sections X, and Y, the area for collecting the dentin cylinder specimen Z, and how the specimen Z was orientated and placed on section X. The non-test side of specimen Z was marked with black permanent marker for orientation.
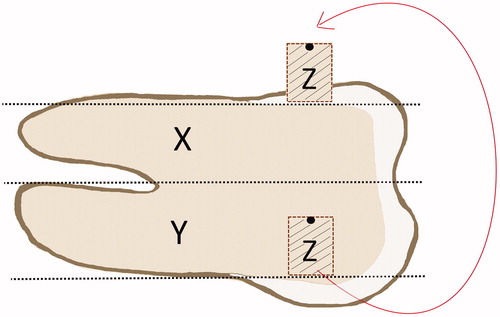
Figure 2. Picture of one acrylic block with the drilled dentine cylinder Z on the left side. On the right side the same cylinder after plane grinding.
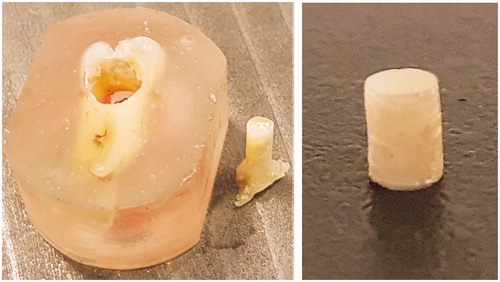
Figure 3. Schematic drawing of test setup and bonded components: epoxy (α), embedded section X (β1), dentin cylinder specimen Z (β2), adhesive layers (γ1, γ2) and resin cement (δ).
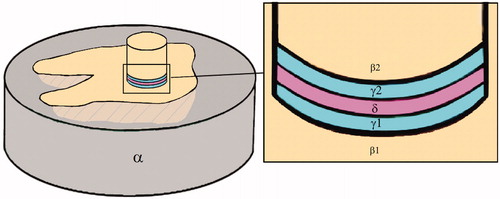
Figure 4. Comparison of all 72 samples (9 combinations, n = 8 specimens per combination). Boxplot of MPa values by combinations: median, maximum, minimum, 25 interquartile range, 75 interquartile range, *control group.
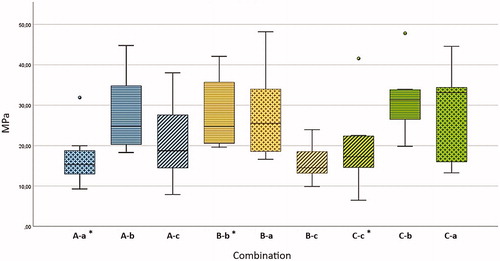
Table 2. Comparison 2 by 2 of the combinations (each n = 8) with the non-parametric Mann-Whitney test.
Figure 5. Boxplot of MPa values and fracture mode for all samples. Fracture mode analyses showed 18% adhesive fractures, 76% cohesive fractures and 6% mixed fractures.
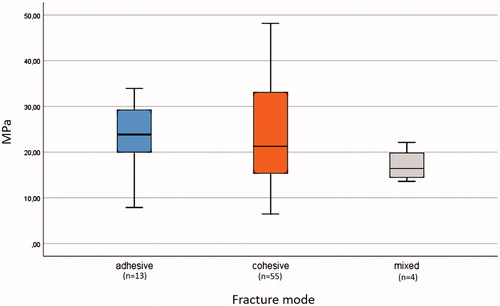
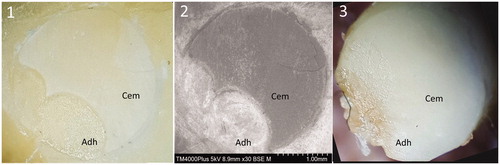
Figure 6. Examples of a mostly cohesive fracture morphology: Combination B-c. (1) Tooth surface X (light microscope), (2) tooth surface X (SEM), (3) dentin cylinder, surface Z (light microscope). Surface Adh: adhesive, Cem: resin cement.