Figures & data
Figure 1. 3D model and milled in vitro restorations: (A) conventional endocrown preparation design and (B) modified endocrown preparation design.
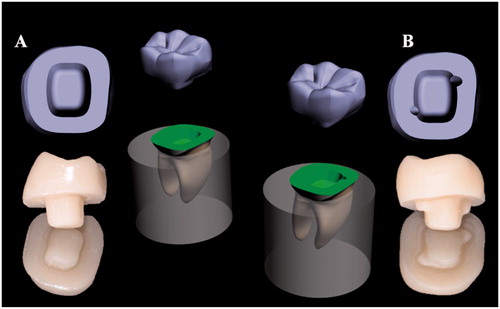
Figure 2. Compressive test using universal testing machine: (A) axial loading, (B) lateral loading for in vitro and in silico test respectively.
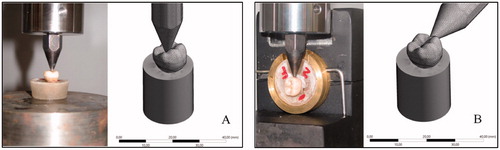
Figure 3. Type I: Cohesive failure; Type II: Adhesive failure; Type III: Cohesive-adhesive failure; Type IV: Fracture of the restoration/tooth complex above the cemento-enamel junction (CEJ); Type V: Fracture of the restoration/tooth complex below the cemento-enamel junction (CEJ).
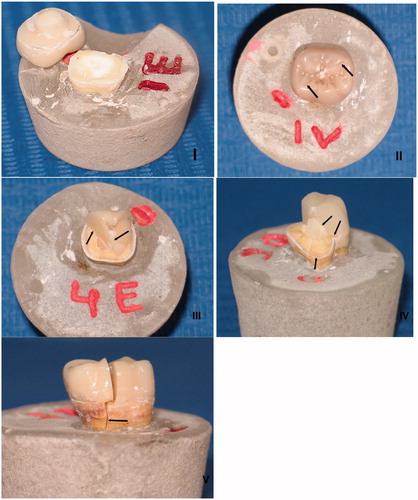
Table 1. Classification of the failure modes.
Figure 4. Stress maps according to each group: (A) in the conventional endocrown restorations with axial loading, (B) in the conventional endocrown restorations with lateral loading, (C) in the modified endocrown design with axial loading and (D) in the modified endocrown design with lateral loading.
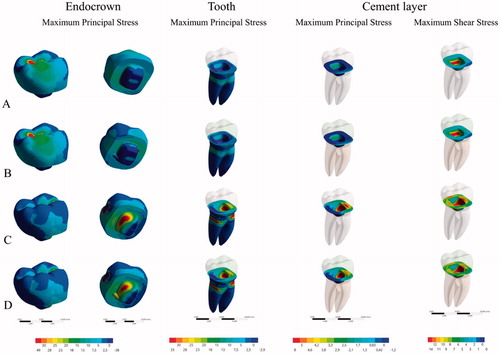
Figure 5. Tensile stress peaks recorded for each structure during the four different simulations. E: Endocrown tensile stress; R: Root dentin tensile stress; SS: Cement shear stress; TS: Cement tensile stress.
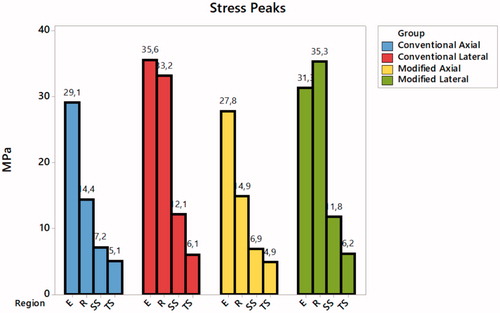
Table 2. Distribution of load (N) to failure by preparation design and loading type (n = 40).
Table 3. Distribution of load (N) to failure by 2-way ANOVA main effects of preparation design and loading (n = 40).
Table 4. Distribution of failure modes by groups and loading type (n = 40).
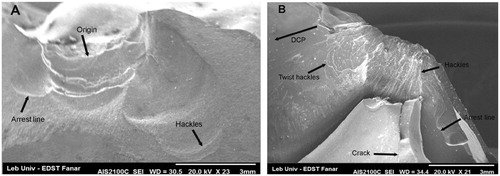
Figure 6. Features of fractographic analysis.