Figures & data
Figure 1. Two examples of ultra-translucent monolithic zirconia crowns delivered from a dental technician with multiple margin flaws (white arrows). These flaws were considered to be due to poor packaging during shipment.
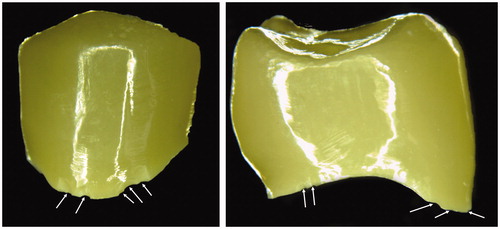
Table 1. Overview over the materials used in the study with abbreviations, brand names, fabrication method, yttria content and name of manufacturer.
Figure 2. Premolar monolithic crowns embedded in epoxy and cut in half were used for the study. Three regions (marginal, axial and occlusal) were analyzed in each crown.
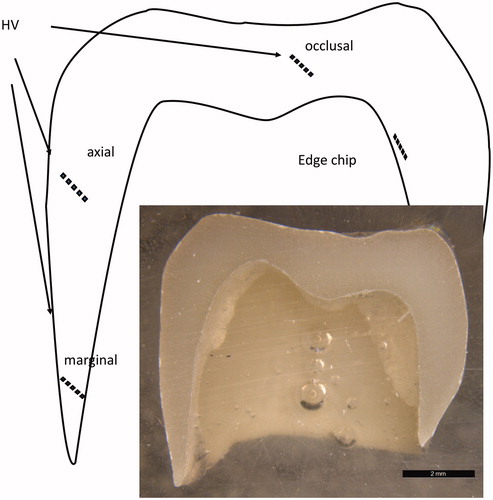
Figure 3. Illustration of the hardness test (A) and the measurement performed (B). 2a is the diagonal length of the indent and 2c is total crack length.
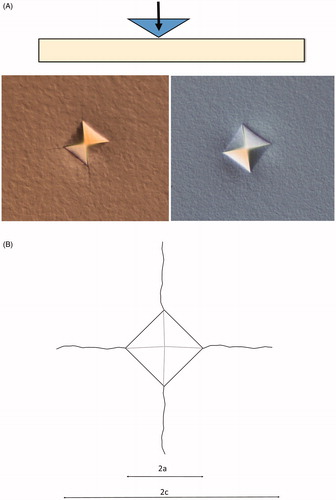
Figure 4. A box plot of the crack/indent-ratio (c/a) for the different test groups. Boxes marked with identical superscript letters and not statistically significant different form each other. Horizontal lines represent median values, the boxes represent the interquartile range and the whiskers indicate maximum and minimum values. Boxes marked with same letter are not statistically significant different form each other.
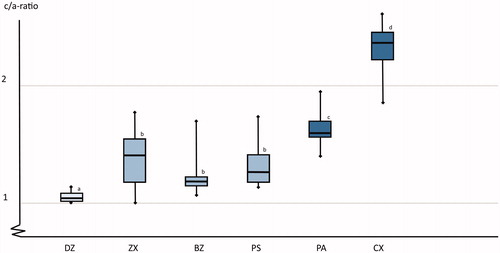
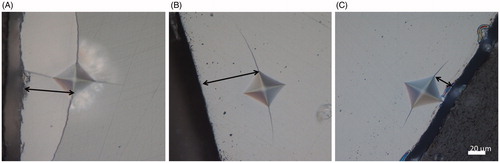
Figure 5. Examples of the variation of the damage zone around the indents as seen in the light microscope. (A) High Yttria content, (B) moderate yttria content, and (C) low yttria content. The arrows indicate end of crack.
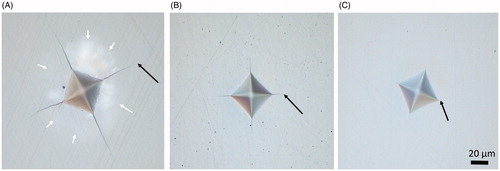
Figure 6. SEM images of typical indentations and cracks in the three different material groups. (A) High yttria content, c/a ratio 2, (B) moderate yttria content, and (C) low yttria content.
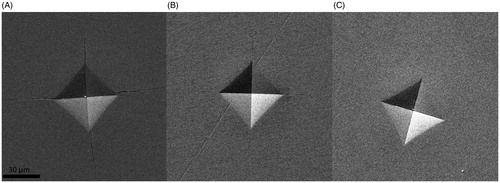
Figure 7. There was apparent differences in how close to the edge an indent could be placed before causing a chip. (A) High yttria content, (B) moderate yttria content, and (C) low yttria content. Arrows indicate distance from the edge.