Figures & data
Figure 1. Gradient chamber (1): (2) Glass slide holder with mounting screws (3) to clamp glass slides (4), while buffer is injected at the bottom, below the nanoparticle solution using a syringe (5) into the chamber (6).
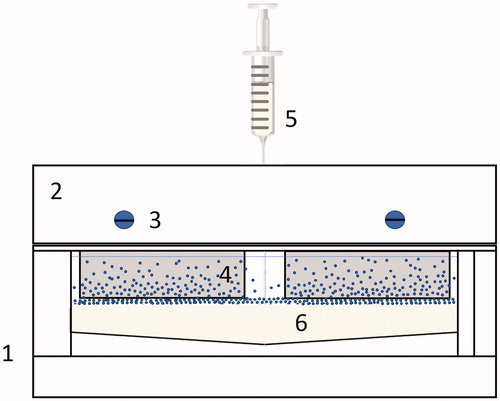
Figure 2. Flow chamber setup. 1: Pressurized air supply. 2: Air output. 3: Water tank. 4: Flow meter. 5: Right valve. 6: Syringe input. 7: Flow chamber with gradient sample (graphical example of the surface below). 8: Left valve. 9: Waste container. Arrows show direction of the flow. Implant image, reprint permission from Shutterstock illustrations-Number: 548568394/TrifonenkoIvan.
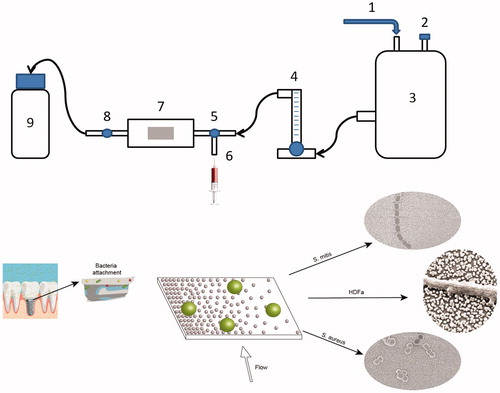
Figure 3. SEM images of nanoparticle gradient (A). Graph presenting surface coverage of nanoparticles (%) as a function of distance along the gradient (B).
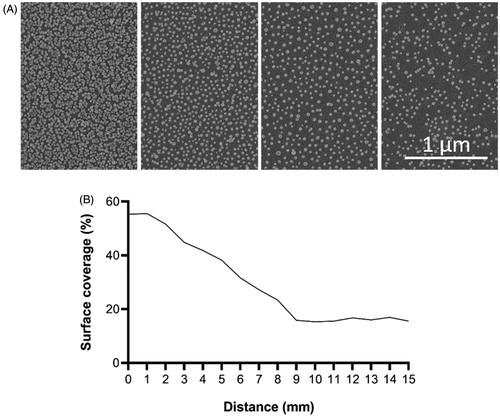
Table 1. Average contact angle values for nanostructured and smooth surfaces before and after heat treatment (n = 7, * p < 0.05: nano versus smooth).
Table 2. Atomic percent of the most common species found in the experimental surfaces before and after heat treatment.
Figure 4. A: Fluorescence images (100× magnification) of Staphylococcus aureus and B: Streptococcus mitis after 5 min attachment and 3 min staining. C: Relative number of adhered cells of S. aureus (blue) and S. mitis (orange) with the standard error of the mean (SEM).

Table 3. Average Spearman correlation coefficients (r) and unstandardized regression coefficient (B) related to the change of bacteria number per 1% of surface coverage values for each experiment (*p < 0.05).
Figure 5. SEM images of bacteria on nanoparticle modified and smooth surfaces: Staphylococcus aureus (A – nano, B – smooth), Streptococcus mitis (C – nano, D – smooth).
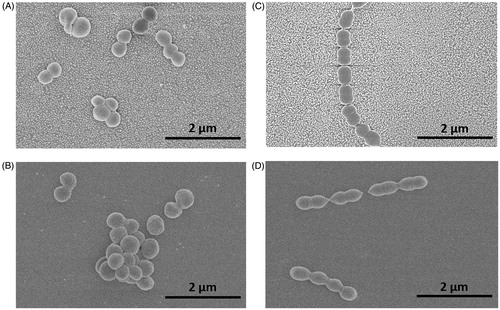
Figure 6. Staphylococcus aureus attachment to homogenous surfaces relative to high coverage of nanoparticles (Nano) in comparison to area with no nanoparticles (Smooth) with the standard error of the mean (SEM) (*p < 0.05).
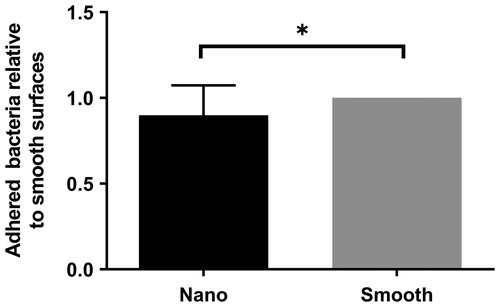
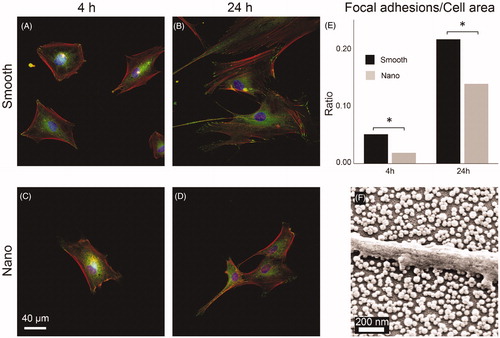
Figure 7. HDFa cells (A–D) stained for nucleus (blue), actin filaments (red), and focal adhesions (green) viewed at 400× magnification after culturing for 4 and 24 h on smooth and nanostructured surfaces. E: ratio between the number of pixels counted for focal adhesions and for the total cell area. (*p < 0.05). f: SEM image of HDFa cell filopodium resting on top of the SiO2 nanoparticles with no contact with the area in-between.