Figures & data
Table 1. Characteristics of the resin-based composites tested according to manufacturer data when available.
Figure 1. Flexural modulus (Eflex, GPa) calculated after three-point bending test (n = 20). The materials are ranked in descending order based on their average values; standard deviations are added as horizontal whiskers for each histogram. Similar capital letters placed on the right side of the material names connect RCs presenting no statistically significant difference (p > .05). Dentin values appear for the sake of comparison: 18–25 GPa [Citation32].
![Figure 1. Flexural modulus (Eflex, GPa) calculated after three-point bending test (n = 20). The materials are ranked in descending order based on their average values; standard deviations are added as horizontal whiskers for each histogram. Similar capital letters placed on the right side of the material names connect RCs presenting no statistically significant difference (p > .05). Dentin values appear for the sake of comparison: 18–25 GPa [Citation32].](/cms/asset/f9ea67a3-319e-4ccd-89d3-96fb80fe9a56/iabo_a_1838283_f0001_c.jpg)
Figure 2. – Flexural strength (σf, MPa) calculated after three-point bending test (n = 20). The materials are ranked in descending order based on their average values; standard deviations are added as horizontal whiskers for each histogram. Similar capital letters placed on the right side of the material names connect RCs presenting no statistically significant difference (p > .05). Dentin values appear for the sake of comparison: 52–105 MPa [Citation32].
![Figure 2. – Flexural strength (σf, MPa) calculated after three-point bending test (n = 20). The materials are ranked in descending order based on their average values; standard deviations are added as horizontal whiskers for each histogram. Similar capital letters placed on the right side of the material names connect RCs presenting no statistically significant difference (p > .05). Dentin values appear for the sake of comparison: 52–105 MPa [Citation32].](/cms/asset/fa25e73e-7713-4a42-a97a-cba4262bbcae/iabo_a_1838283_f0002_c.jpg)
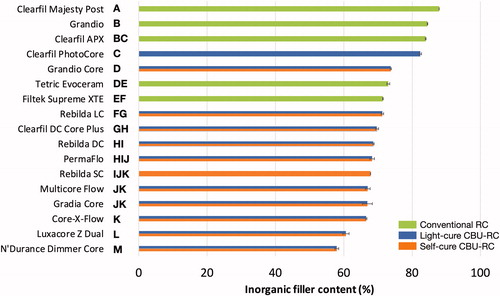
Figure 3. – Inorganic filler content (%) measured by thermogravimetric analysis (n = 3). The materials are ranked in descending order based on their average values; standard deviations are added as horizontal whiskers for each histogram. Similar capital letters placed on the right side of the material names connect RCs presenting no statistically significant difference (p > .05).