
Figures & data
Table 1. Ingredients and product forms of the investigated dentifrices according to manufacturers.
Figure 1. The mean abraded depths (µm) of the tested dentifrices, reference and controls displayed as median and interquartile range. *Significantly different from DW, p < .05 (n = 6).
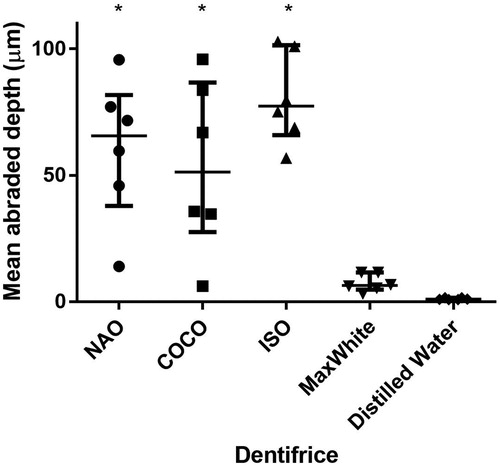
Figure 2. Illustration of the brushed zone depth profile widthwise of the tooth specimen. One typical tooth specimen from each group (a)–(e) is shown.
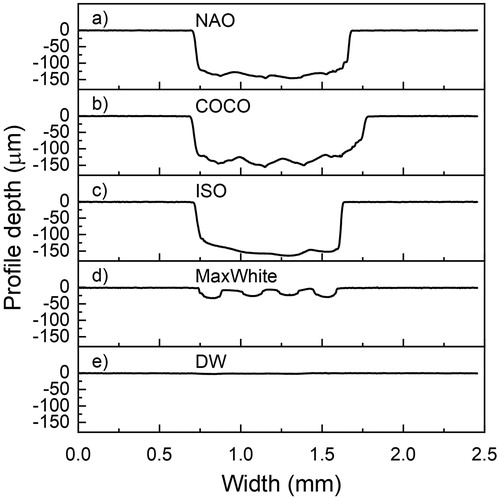
Figure 3. The surface roughness (Ra) in μm of the investigated dentifrices, reference and controls displayed as median and interquartile range.*Significantly different from ISO dentifrice slurry and DW, p < .05 (n = 6).
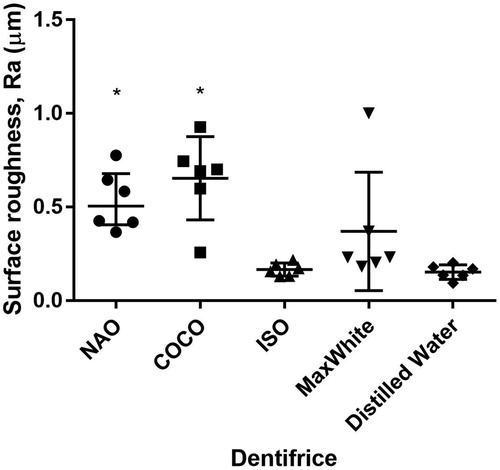
Figure 4. Mean fluoride concentration (ppm ± SD) of the investigated dentifrices detected between 0 and 24 h (n = 3).
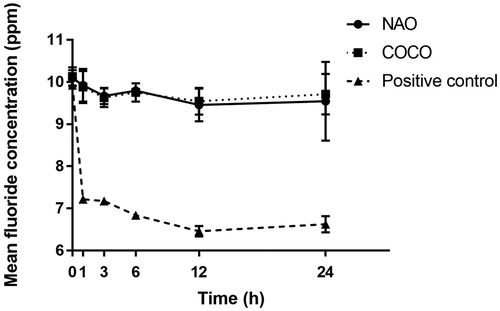
Table 2. pH ± SD of the investigated dentifrices in distilled water and artificial saliva.