Figures & data
Figure 1. Finite-element models simulating four bone densities conditions: low-dense maxilla (LD-Mx), control maxilla (C-Mx), control mandible (C-Md), and high-dense mandible (HD-Md). Ct: cortical bone thickness (in mm). TE: trabecular bone elastic modulus (in GPa).
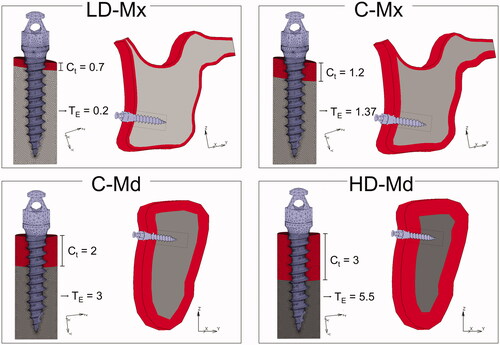
Table 1. Material properties used in the study.
Figure 2. Boundary conditions of the finite element models. A mesial load was applied to the head of the mini-implant, and the displacement of the nodes located at the cutting bone surfaces was restricted (zero degrees of freedom). A: OMI dimensions and loading. B: Maxilla models. C. Mandible models.
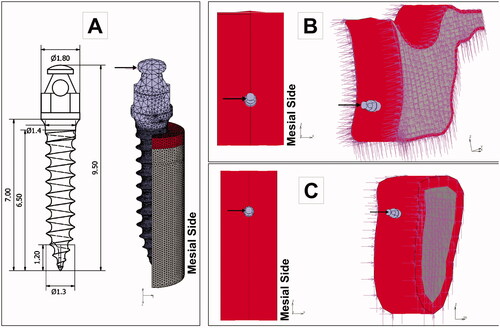
Figure 3. Intra-bone OMI displacement (µm) distribution for the four FE models: low-dense maxilla (LD-Mx), control maxilla (C-Mx), control mandible (C-Md), and high-dense mandible (HD-Md).
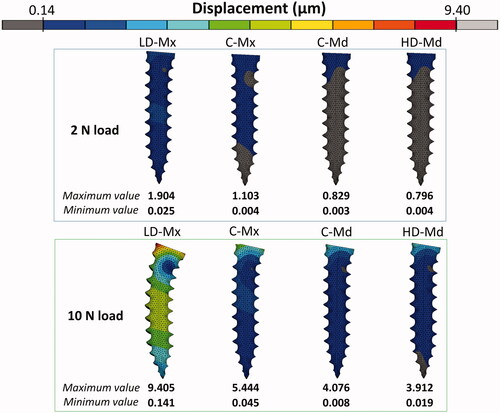
Figure 4. Major strain distribution (µstrain) distribution for the four FE models under 2 N: low-dense maxilla (LD-Mx), control maxilla (C-Mx), control mandible (C-Md), and high-dense mandible (HD-Md).
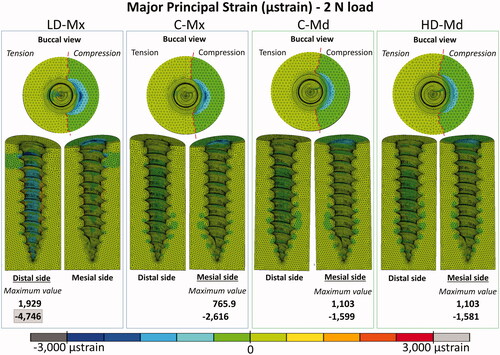
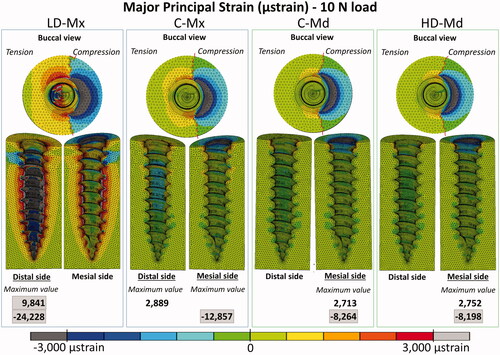
Figure 5. Major principal strain distribution (µstrain) distribution for the four FE models under 10 N: low-dense maxilla (LD-Mx), control maxilla (C-Mx), control mandible (C-Md), and high-dense mandible (HD-Md).