Figures & data
Table 1. Classification of the experimental resins used in the study according to their composition and calculated refractive index (RI).
Figure 1. (a) Visual image of 1 mm thick resin composite specimens placed over a black line. (b) Translucency parameter mean values (TP) of experimental resin composites. Vertical lines represent standard deviation. The same letters inside the bars represent non-statistically significant differences (p > .05) among the materials.
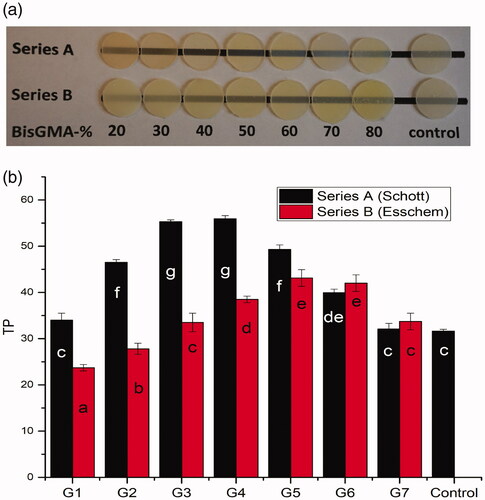
Table 2. Calculated refractive indices of the experimental resin composites.
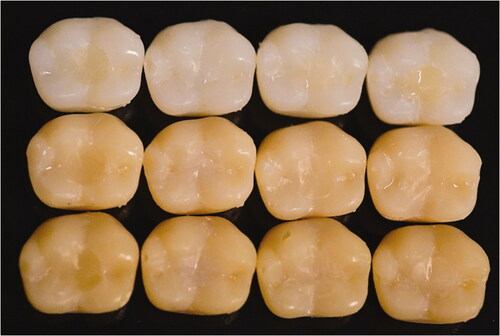
Figure 2. Representative images of different colored plastic crowns with composite restorations for visual color matching analysis. From left to right: G1A, G7A, Omnichroma, Filtek Supreme (shade A3). Shades from up to down: A1, A3, A4.