Figures & data
Figure 1. CONSORT Flow diagram.
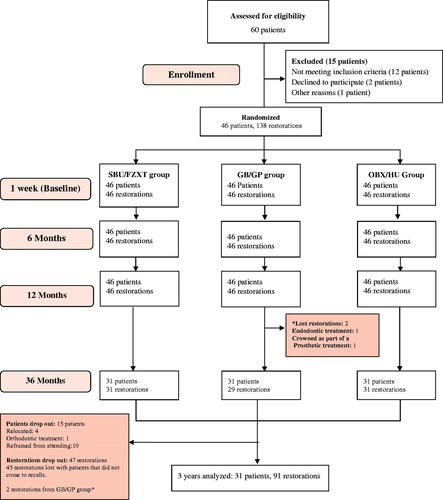
Table 1. Distribution of cavity class among groups.
Table 2. Distribution of tooth types among groups.
Table 3. Name, composition, application and batch numbers of used materials.
Table 4. Modified US Public Health Service criteria for direct clinical evaluation of restorations.
Table 5. Descriptive statistics of the evaluated parameters for each restorative system.
Table 6. Failed restorations during the 36 months evaluation, tooth type, year, and reason for failure.
Table 7. Number and percentages of restorations for each group evaluated according to the modified USPHS criteria.
Figure 2. (a) Tooth 15 MOD (SBU/FZXT) preoperative. (b) Tooth 15 MOD (SBU/FZXT) at Baseline. (c) Tooth 15 MOD (SBU/FZXT) at 6 months. (d) Tooth 15 MOD (SBU/FZXT) at 12 months. (e) Tooth 15 MOD (SBU/FZXT) at 36 months.
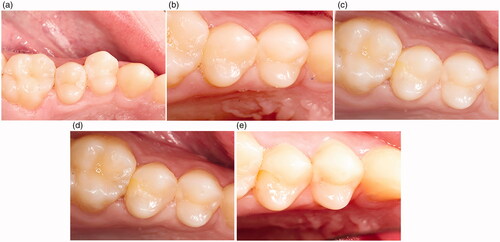
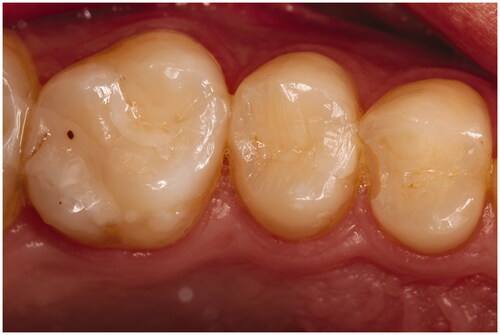
Figure 3. Tooth 14 OD (SBU/FZXT) superficial marginal discoloration at 36 months.
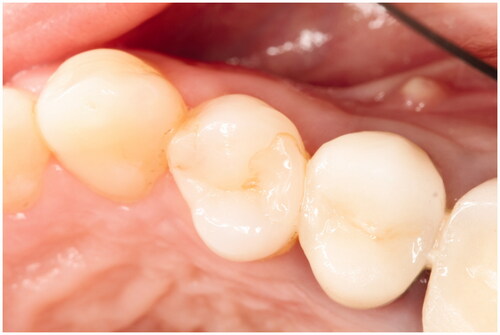
Figure 4. Tooth 24 OD (GB/GP) Marginal fracture at 6 months.