
Figures & data
Figure 1. Schematic presentation of class V preparation.
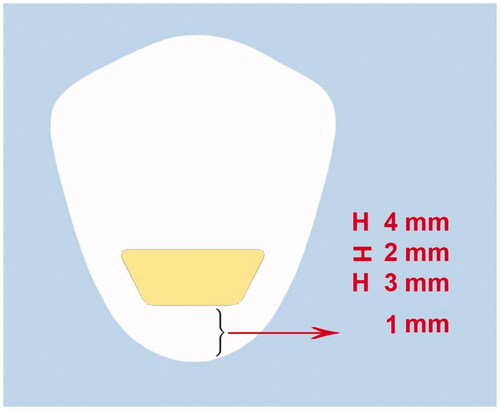
Table 1. Materials used in the study and their compositions.
Figure 2. Diagram of microleakage evaluation criteria for class V cavity.
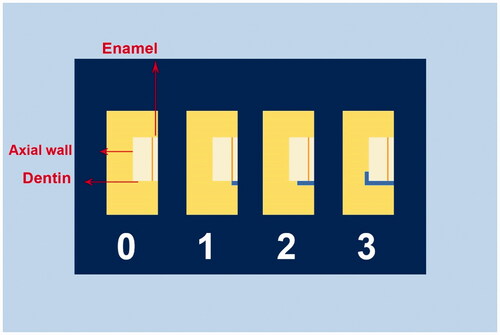
Figure 3. Representative stereomicroscopic images; a: no microleakage was detected (score 0, b: microleakage into the enamel portion of the cavity was detected (score 1), c: microleakage to the dentinal portion of the cavity without axial wall penetration was detected (score 2), d: microleakage into pulpal floor of the cavity was detected (score 3).
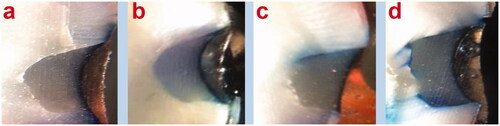
Table 2. Comparison of marginal microleakage scores in the study groups by Kruskal–Wallis test.
Table 3. Pairwise comparisons of microleakage between the groups by the Dunn test.