Figures & data
Figure 1. The molar preparation with curvatures on the approximal sides to resemble clinical preparations. (a) mesial view, (b) distal view and (c) the designed crown from the distal view.
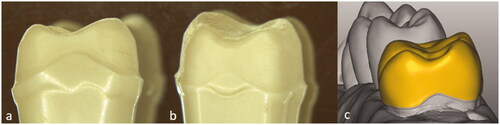
Table 1. Material groups used with material names, composition and sintering temperatures, (producers' information).
Figure 2. Flow chart of the different cementation procedures.
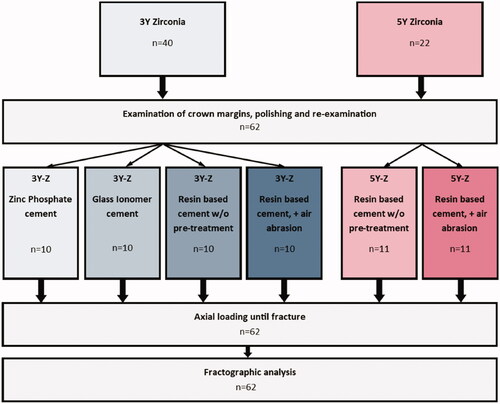
Figure 3. The test set-up. (A) Schematic illustration of the test during loading. (B) Photo of test during loading.
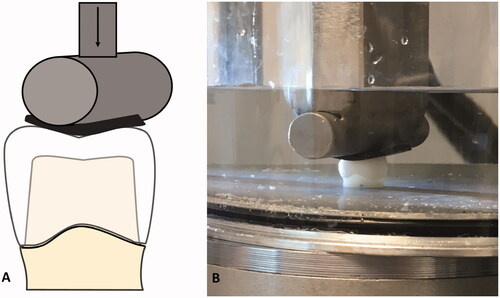
Figure 4. Boxplot of load at fracture (N). Statistically significant differences were found between the two material groups. Statistically significant differences between the different cementation groups are marked with different letters.
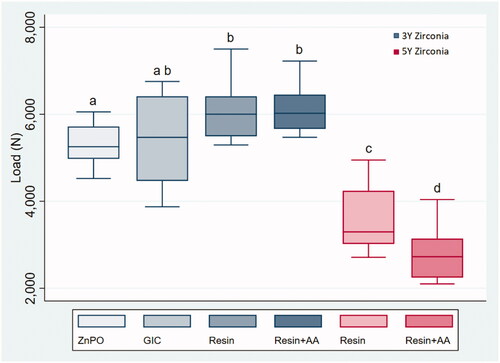
Figure 5. Fractographic map of a fractured crown (3Y zirconia). The origin can be traced back to the crown margin on the mesial curvature (large open arrow). Small white arrows indicate the direction of crack propagation.
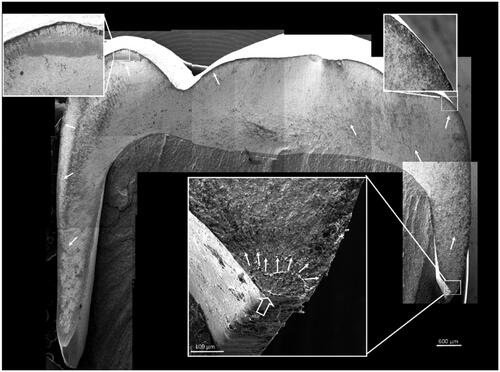
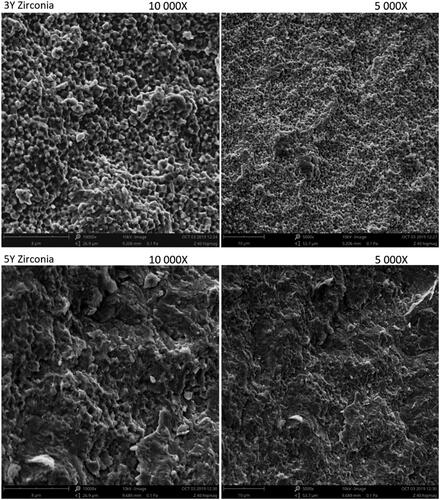
Figure 6. SEM images of the inside of the crowns before (A, C) and after air-abrasion (B, D). The grain structure is clearly different between the 3Y and 5Y zirconia. (A) The 3Y har more homogenous grain structure (1–3 µm). (C) The 5Y has a larger variation in grain size (<1 to >5 µm). (B, D) The air-abrasion results in a severely different surface structure, but there is no apparent difference between the two material surfaces after air-abrasion. Scanning electron microscopy images in back scatter mode.
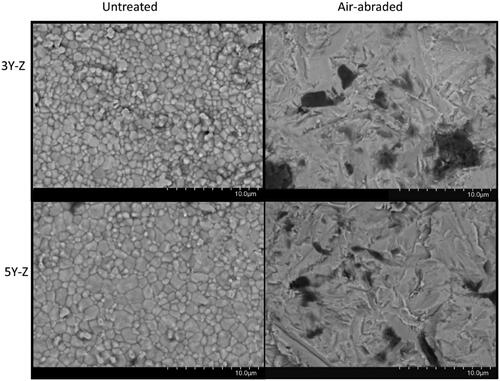
Figure 7. SEM images (secondary emission mode) of typical fracture surfaces of the two material groups. (A, B) The 3Y zirconia display mostly intergranular fracture surface. (C, D) 5Y zirconia display mixed intergranular and transgranular fracture surfaces.