Figures & data
Table 1. Cements used and their adhesive methods to ceramic and tooth substance.
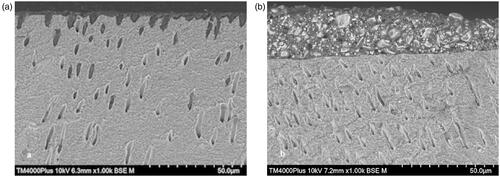
Figure 1. SEM images of air borne particle abraded zirconia (a), KHF2 etched zirconia (b) and hydrofluoric acid etched lithium disilicate (c). Bar represents 50 µm.
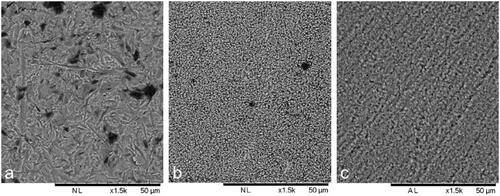
Figure 2. Box plot of shear bond strength of ceramic rods cemented to dentin (P500). The horizontal line represents the mean value, lower part of the box represents 25% quartile, the upper part of the box represents 75% quartile. The vertical lines represent a 90% confidence interval. Different lowercase letters illustrate significant difference (p < .05) between Zir A, Zir E and LDS for each cement. Different uppercase letters illustrate significant differences (p < .05) between cements for each ceramic.
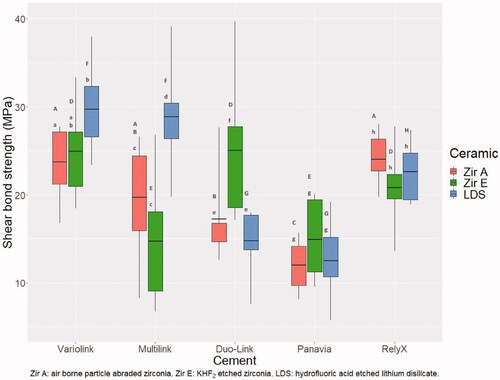
Figure 3. Fracture morphology after shear bond strength testing for ceramic rods cemented to dentin ground with P500 SiC paper.
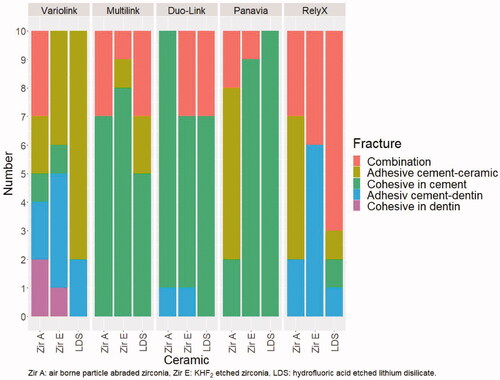
Figure 4. Box plot of shear bond strength for Zir E cemented to dentin ground with P80 and P1200 grit SiC paper. The horizontal line represents the mean value, lower part of the box represents 25% quartile, the upper part of the box represents 75% quartile. The vertical lines represent a 90% confidence interval. Different lowercase letters illustrate significant differences (p < .05) between cements for each surface roughness. Different uppercase letters illustrate significant differences (p < .05) between P80 and P1200 for each cement.
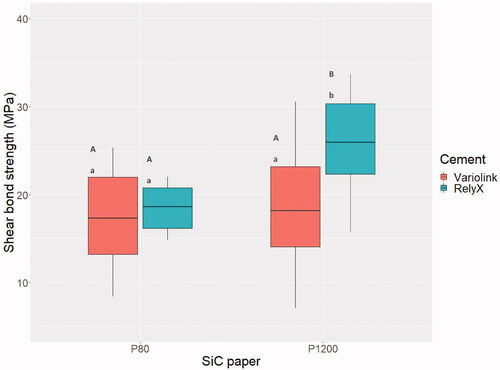
Figure 5. Fracture morphology after shear bond strength testing of Zir E cemented to dentin ground with P80 and P1200 SiC paper.
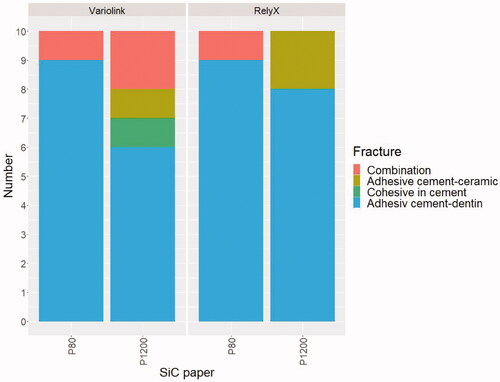
Figure 6. SEM images of dentin and remnants of cement after shear bond strength testing of Zir E cemented with Variolink (a) and RelyX (b) to dentin ground with P1200 SiC paper. 6a: Resin tags in dentin tubules. 6b: Remnant of RelyX on the dentin surface showing that the cement did not penetrate the dentin tubules.