
Figures & data
Table 1. Composition of the experimental adhesives.
Figure 1. Device used for the cementation procedure.
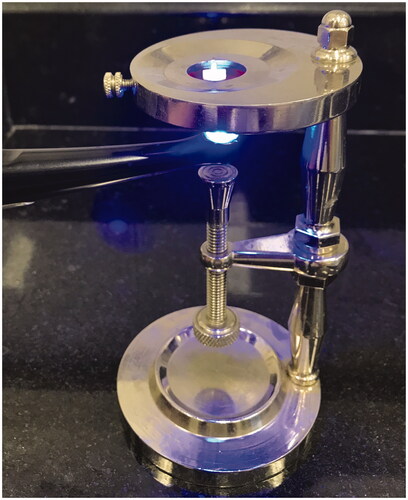
Figure 2. Mean values of degree of conversion (DC) (%). Different letters on top of each column indicate statistically significant difference between experimental adhesives (p < .05). Adhesives prepared without DABE did not cure properly and were not included in the analysis.
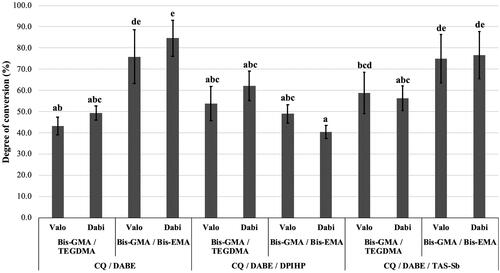
Table 2. Mean values and standard deviations of degree of conversion (DC), water sorption (SO), and water solubility (SL).
Figure 3. Mean values of water sorption (SO) (µg/mm3). Different letters on top of each column indicate statistically significant difference between experimental adhesives (p < .05).
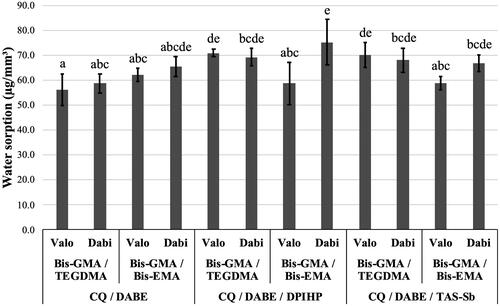
Figure 4. Mean values of water solubility (SL) (µg/mm3). Different letters on top of each column indicate statistically significant difference between experimental adhesives (p < .05).
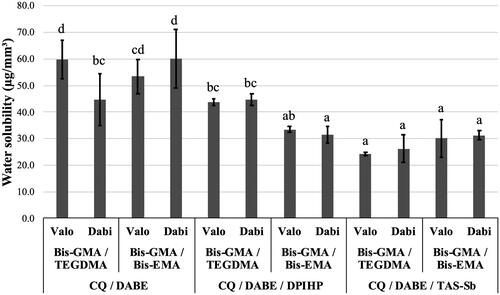
Figure 5. Mean values of shear bond strength (µSBS) (MPa) of experimental adhesives. Different letters on top of each column indicate statistically significant difference between experimental adhesives (p < .05).
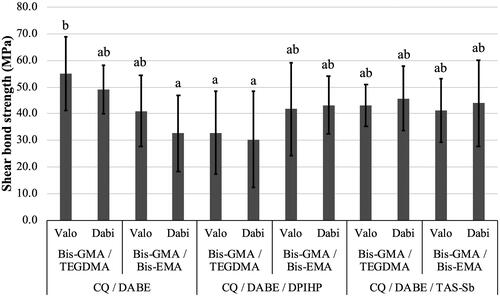
Table 3. Mean values and standard deviations of microshear bond strength (µSBS).