Figures & data
Table 1. The flowable resin composites used in the study.
Table 2. Test groups and their interfacial surface treatments.
Figure 1. Schematic figure of the debonding test (shear bond strength test) setup.
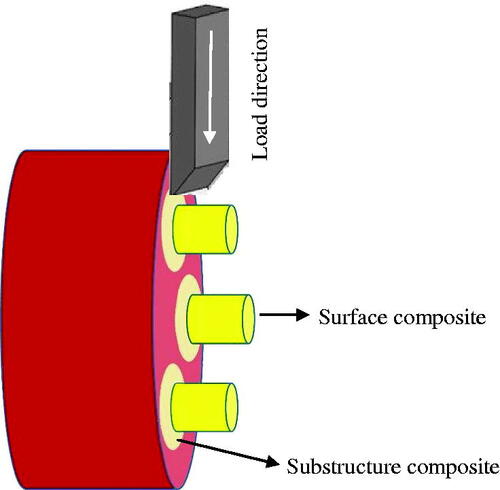
Figure 2. Shear bond strength (mean values and standard deviations; MPa) of the tested groups (n = 18). Same letters indicate no statistically significant differences between groups.
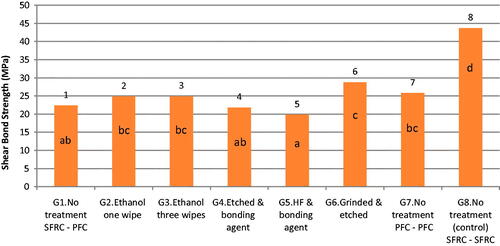
Figure 3. Percentage of the various failure modes in the tested groups (n = 18).
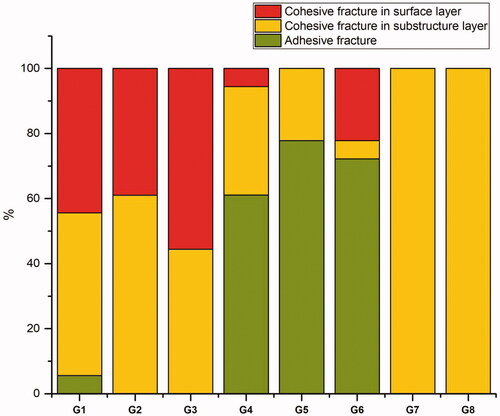
Figure 4. SEM images of an ethanol-treated surface of SFRC at different magnifications.
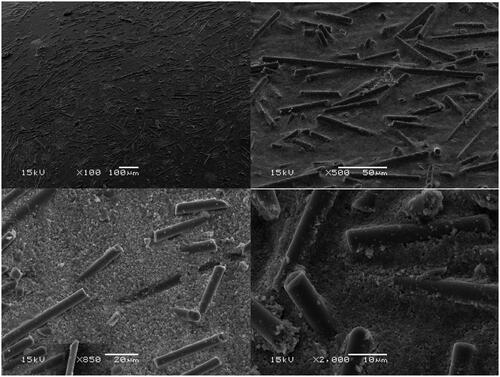
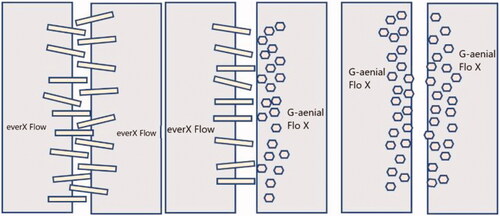
Figure 5. Schematic figure of the nature of interlayer surfaces between the tested materials.