Figures & data
Table 1. Materials used in the experiments.
Figure 1. Bond strength of universal bonding agents and control, Optibond FL. (A) 2 weeks storage in water. (B) 1 year storage in water. Box represents the 25 and 75% percentile, solid, horizontal line represents the median, and the dot represents the mean value. Whiskers show minimum and maximum values. Asterisk (*) indicates statistical difference from control, Optibond FL, p < .01.
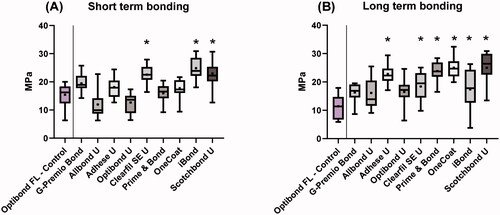
Table 2. Number of pre-test failures (PTF) after 2 weeks and after 1 year (n = 15).
Figure 2. Chemical structure of GPDM.
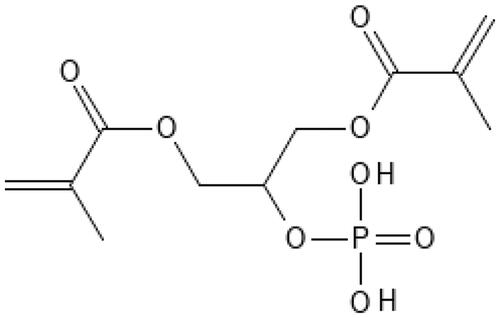
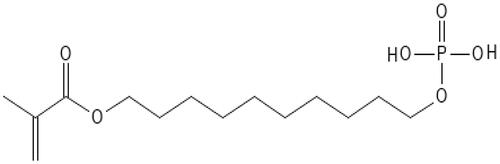
Figure 3. Chemical structure of 10-MDP.