Figures & data
Figure 1. Finite-element model descriptions: geometry (mm), mesh, boundary conditions (fixed nodes), and occlusal loading (N: newton). L: implant length, : implant diameter, BBT: buccal bone thickness, ROI: region of interest (only the mesial ROI is visible in the image, but distal ROI was also used to calculate the peri-implant bone resorption risk indexes).
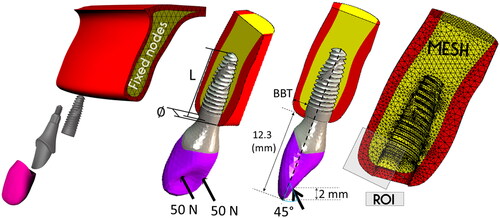
Table 1. Simulated dental implant geometries.
Table 2. Materials properties.
Figure 2. Frost’s mechanostat windows based on the bone density change as a function of the mechanical stimulus. Sp: mechanical stimulus that drives the bone into pathologic resorption window. SED: strain energy density (in µJ/mm3). ε: strain (in µstrain = 1 µm/m). ρ: bone density. Δρ: bone density variation.
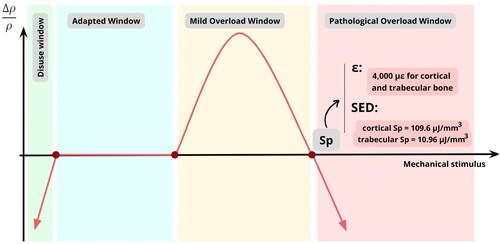
Figure 3. Strain energy density (SED) distribution and mean of top 10 SED for cortical and trabecular buccal bone. A: using the same color range adjustment for cortical and trabecular bone. B: using specific color range adjustments for cortical and trabecular bone, according to each bone SED pathologic resorption limit (Sp) value (109.6 µJ/mm3 for cortical and 10.96 µJ/mm3 for trabecular bone).
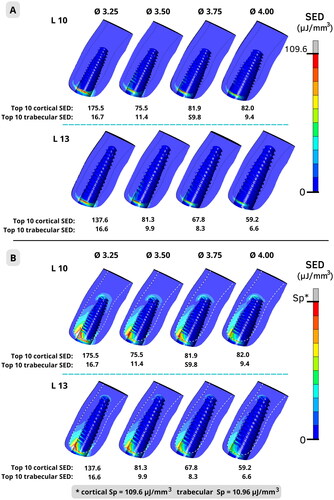
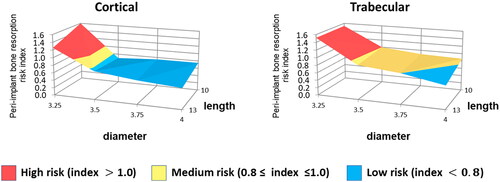
Figure 4. Peri-implant bone resorption risk index (PIBRri) for cortical and trabecular bones.