Figures & data
Figure 1. Structure of nacre; (a) natural nacre in an abalone shell (Halitosis iris); (b,c) aragonite platelets in brick-and-mortar structure; (d) arrows showing the nano-asperities on the surface of platelets providing a rough surface and increasing friction; (e) fracture pattern of nacre showing platelet pull out and bridging as well as crack deviations (arrows), more clearly seen in (f), schematic of nacre failure on the microscopic level.
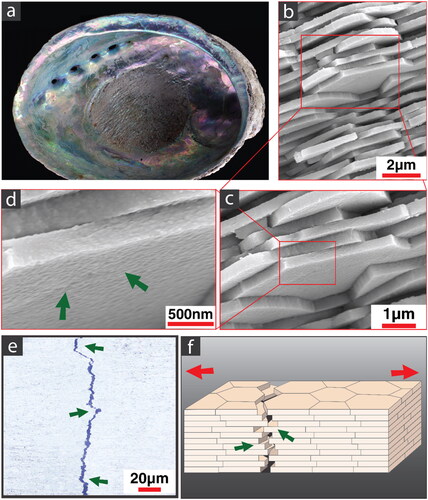
Figure 2. (a) Method of processing the experimental flake-reinforced composites; (b) SEM of fracture surface of the flake-reinforced composite; (c) SEM of surface after removing polymer.
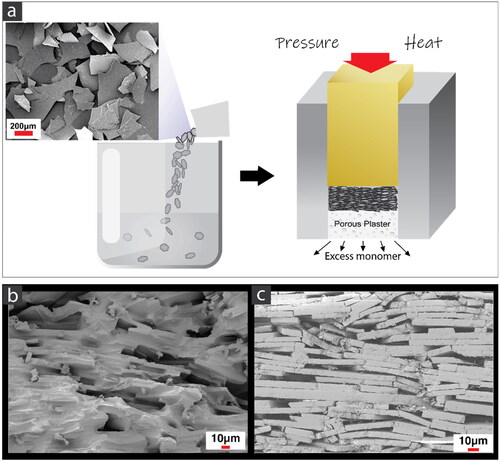
Figure 3. R-curves of silanized and non-silanized experimental flake-reinforced composites. Fracture toughness is shown in terms of stress intensity KR (a) and nonlinear elastic fracture, JR (b). Included were data on conventional composites (particles, grey dots):KR data taken from Shah et al. [Citation22] (see ) and JR data from Wendler et al. [Citation6] and De Souza et al. [Citation21] (see ). Glass-reinforced composite data (particles + orientated short-fibers, red dots) KR and JR from Tiu et al. [Citation5] were added.
![Figure 3. R-curves of silanized and non-silanized experimental flake-reinforced composites. Fracture toughness is shown in terms of stress intensity KR (a) and nonlinear elastic fracture, JR (b). Included were data on conventional composites (particles, grey dots):KR data taken from Shah et al. [Citation22] (see Figure 3(a)) and JR data from Wendler et al. [Citation6] and De Souza et al. [Citation21] (see Figure 3(b)). Glass-reinforced composite data (particles + orientated short-fibers, red dots) KR and JR from Tiu et al. [Citation5] were added.](/cms/asset/158570d7-267d-431a-9c5b-6bff622c47ae/iabo_a_2150625_f0003_c.jpg)
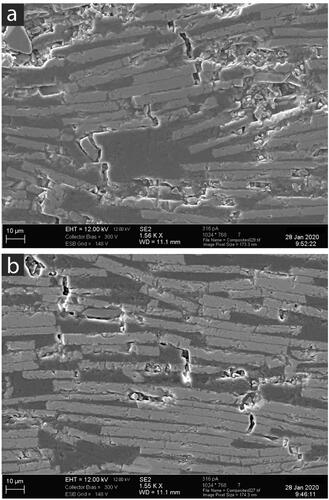
Figure 4. Micrographs of crack patterns along the surface of the flake-reinforced composites.