
Figures & data
Table 1. Manufacturers, shade, composition and lot number of the materials tested in the present study.
Figure 1. Cylinders (3 × 3 mm) of the experimental materials. (A) Ivotion-Dent, (B) Ivotion-Base, (C) Empress Direct and (D) IvoBase-Hybrid placed in custom-made transparent acrylic resin for toothbrush simulation after surface polishing.
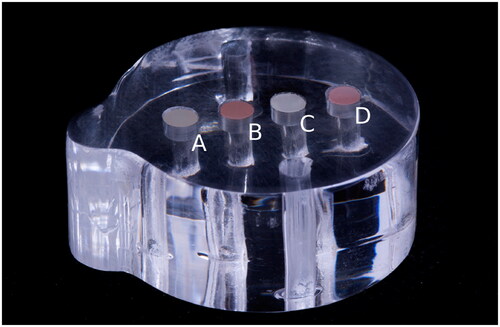
Figure 2. Mean and 95% CI for Ra surface roughness parameter of the tested materials as a function of RDA level and timepoint. *I: immediate; **F: final. ***Different letters represent significant statistical difference.
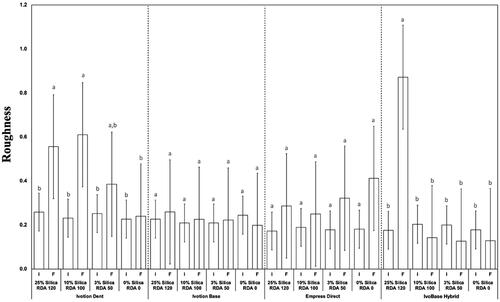
Figure 3. Representative SEM micrographs (10kx) of all tested groups. Ivotion-Base: A–E; Ivotion-Dent: F–J; Empress Direct: K–O; IvoBase-Hybrid: P–T. Different topographical patterns of the materials after toothbrushing for 72,000 cycles were observed as a function of dentifrice RDA. Baseline, RDA 0, RDA 50, RDA 100, RDA 120, from left to right, respectively.
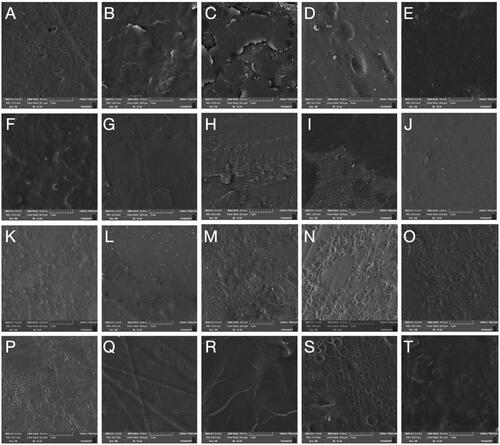
Figure 4. Mean and 95% CI for microhardness parameter of the tested materials as a function of RDA level and timepoint. *Different letters represent significant statistical difference.
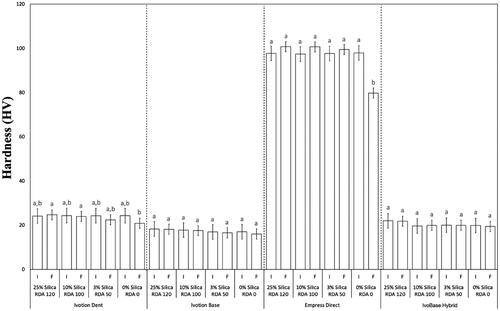
Figure 5. Mean and 95% CI for translucency parameter (TP) of the tested materials as a function of RDA level and timepoint. *Different letters represent significant statistical difference.
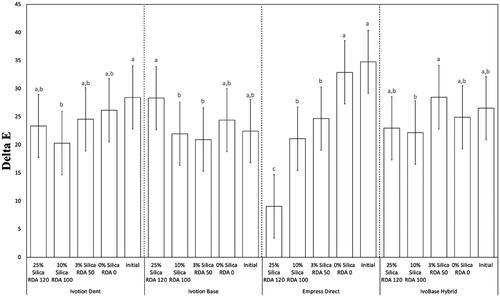
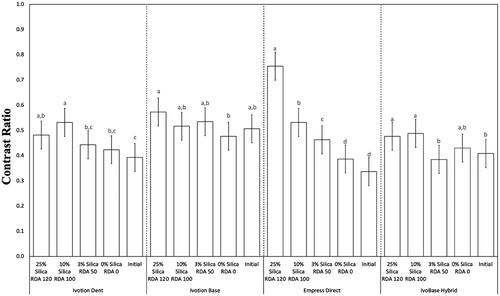
Figure 6. Mean and 95% CI for contrast ratio parameter of the tested materials as a function of RDA level and timepoint. *Different letters represent significant statistical difference.
Data availability statement
The data that support the findings of this study are available from the corresponding author upon reasonable request.