Figures & data
Figure 1. Sample scoring of the SEM image.
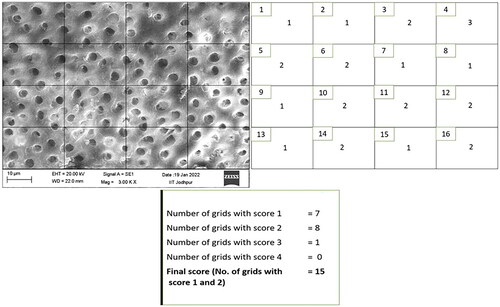
Table 1. Inter-group comparison of median values of the final scores in control, EDTA, MTAD and CAP Plasma Jet.
Table 2. Intra group comparisons of the median values of the final scores in coronal, middle and apical third of the samples analyzed.
Table 3. Inter-group comparison of median values of the final scores in coronal, middle and apical third regions.
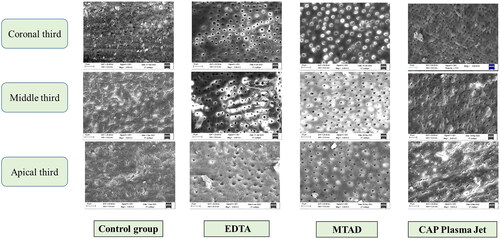
Figure 2. Representative SEM images of the samples analyzed.