Figures & data
Figure 1. Structures of DFMA, SR833s, and FBMA.
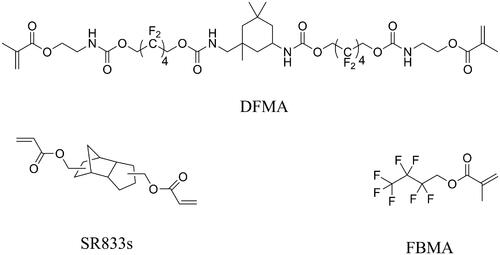
Table 1. Components of the resin matrix for each dental resin composite
Figure 2. The fracture section morphology of DRCs. (A) BT; (B) DS; (C) DSF-1; (D) DSF-2; (E) DSF-3.
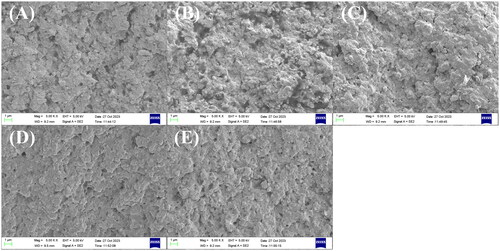
Table 2. Results of double bond conversion (DC), volumetric shrinkage (VS), and shrinkage stress (SS) of DRCs
Table 3. Results of contact angle and surface free energy of DRCs
Figure 3. The amounts of S. mutans recovered from the surface of dental resin composites. Identical lower-case letters indicate that there was no significant difference in the amounts of S. mutans between the different groups (p = 0.05).
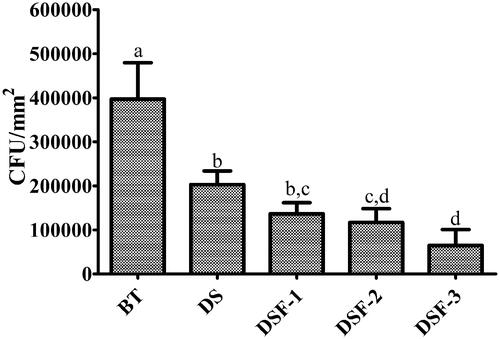
Figure 4. The results of flexural strength (A) and modulus (B) before and after water immersion of dental resin composites. Identical lower-case letters indicate that there was no significant difference in flexural strength or modulus between the different groups before water immersion (p = 0.05), while identical upper-case letters indicate that there was no significant difference in flexural strength or modulus between the different groups after water immersion (p = 0.05).
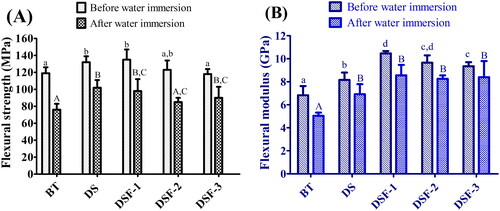
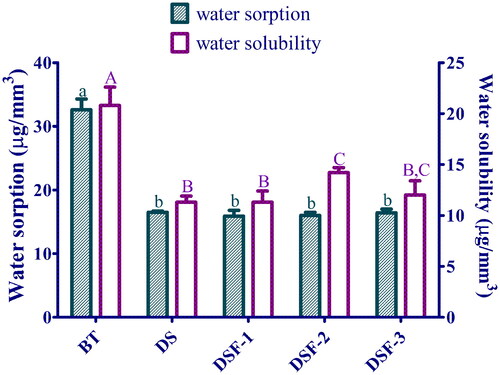
Figure 5. The water sorption and solubility of dental resin composites. Identical lower-case letters indicate that there was no significant difference in water sorption between the different groups (p = 0.05), while identical upper-case letter indicate that there was no significant difference in water solubility between the different groups (p = 0.05).