1,000
Views
1
CrossRef citations to date
0
Altmetric
Special Section: COVID-19 and Local Development Commentaries

What kind of cities are more vulnerable during the COVID-19 crisis?

ORCID Icon
Pages 74-82 | Received 24 Apr 2020, Accepted 06 Jul 2020, Published online: 17 Aug 2020

Figures & data

Table 1. Subsector breakdown

Figure 1. Histogram with cities reliant on retail (44–45) and food/accommodation (72) sectors

Figure 1. Histogram with cities reliant on retail (44–45) and food/accommodation (72) sectors

Figure 2. Histogram of city sales change

Figure 2. Histogram of city sales change

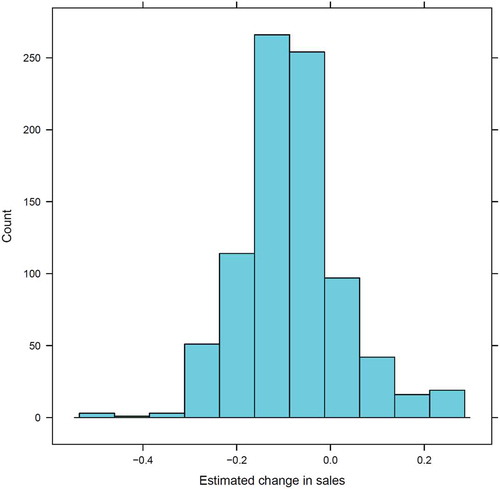
Table 2. Municipalities with most declines, highest increases, and largest cities in Ohio

Figure 3. Sales changes in the Cleveland area

Figure 3. Sales changes in the Cleveland area

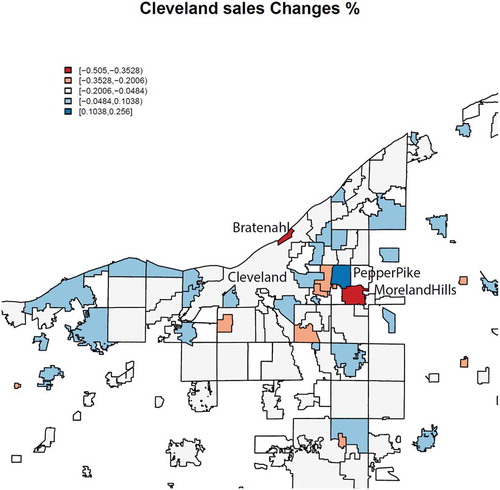
Table 3. Correlations of key city features and sales change

Reprints and Corporate Permissions

Please note: Selecting permissions does not provide access to the full text of the article, please see our help page How do I view content?

To request a reprint or corporate permissions for this article, please click on the relevant link below:

Academic Permissions

Please note: Selecting permissions does not provide access to the full text of the article, please see our help page How do I view content?

Obtain permissions instantly via Rightslink by clicking on the button below:

If you are unable to obtain permissions via Rightslink, please complete and submit this Permissions form. For more information, please visit our Permissions help page.