Figures & data
Table 1. Products evaluated as nucleating agents (NAs) for PLA.
Table 2. Codes of PLA(NA)/PA12 samples and their composition.
Figure 1. Comparative DSC traces of starting neat PLA and of PLA-NA1-5 samples recorded (a) during cooling and (b) second heating (rate of 10 °C/min).
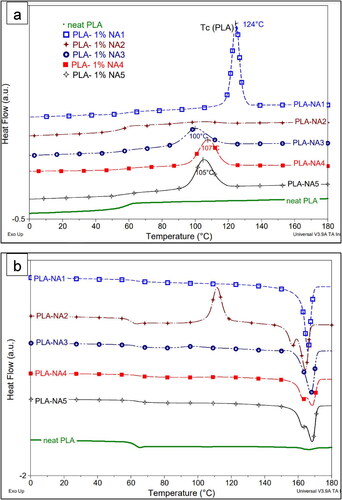
Table 3. Comparative DSC data on starting PLA and PLA-NA1-5 samples obtained during non-isothermal crystallization from the molten state (cooling by 10 °C/min) and following the succeeding heating scan.
Figure 2. Comparative DSC curves of starting PLA and PLA(NA) displayed during cooling and second heating scan at rate of 10 °C/min and quantification of the main information.
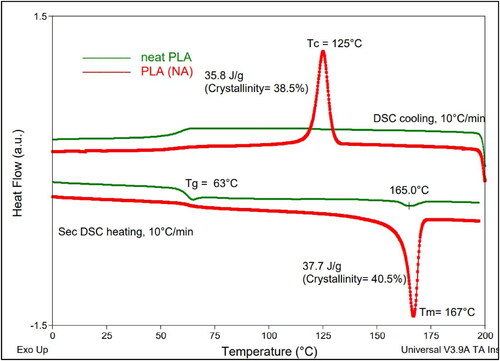
Figure 3. DSC traces obtained during crystallization of PLA(NA) under isothermal conditions for determination of half crystallization time (t1/2). In the inset of figure: isothermal crystallization of starting neat PLA at 110 °C assessing for a very long t1/2.
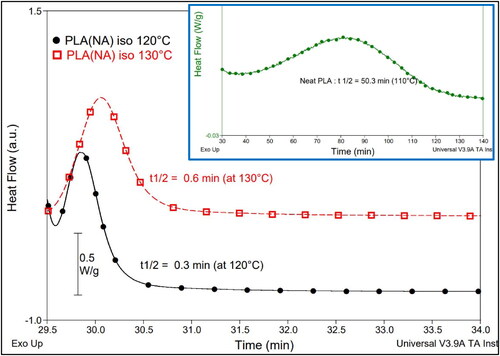
Figure 4. Comparative DSC curves of (a, b) PLA(NA) and (c) neat PLA after IM at different temperatures of the mould and distinct residence time.
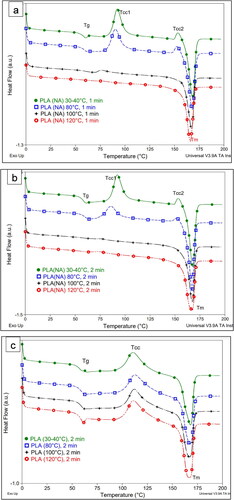
Table 4. Degree of crystallinity (%) of neat PLA and PLA(NA) following the processing by injection moulding at different mould temperatures.
Figure 5. (a–f) SEM micrographs of cryofractured surfaces of PLA(NA), PA12, and PLA(NA)/PA samples.
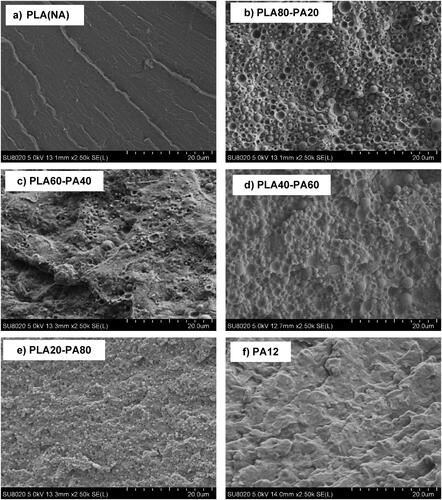
Figure 6. (a–d) SEM micrographs of PLA(NA)/PA12 samples previously “etched” in chloroform.
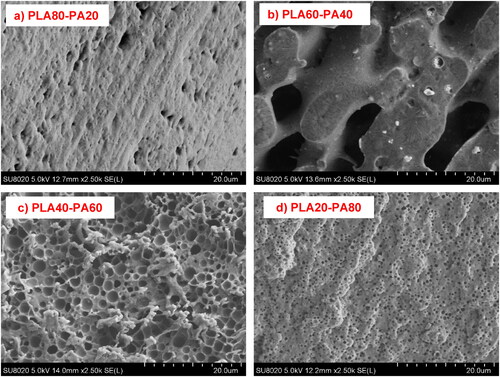
Figure 7. (a, b) SEM micrographs of previously “etched” PLA50-PA50 samples to illustrate the inversion of the phase (PLA pass into PA as matrix).
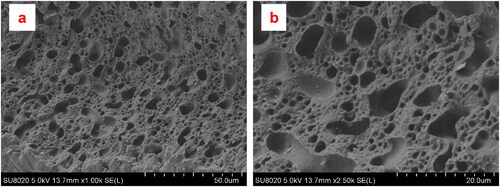
Figure 8. Scheme to illustrate the morphology evolution by increasing the amounts of PA12 in PLA(NA)/PA blends.
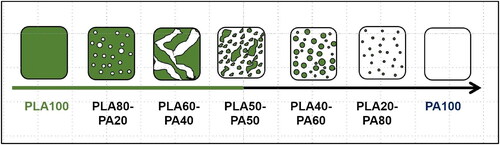
Figure 9. TG (a) and D-TG curves (b) of PLA(NA), PA12, and PLA/PA blends (under air, 20 °C/min).
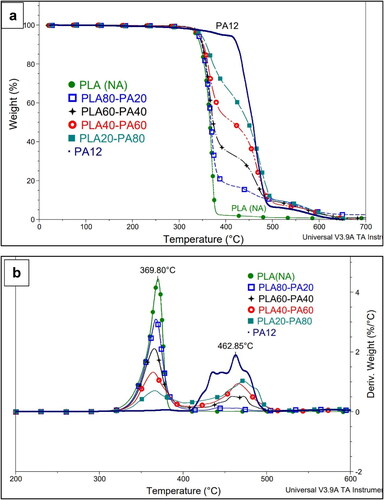
Table 5. Thermal parameters of PLA(NA), PA12 and PLA(NA)/PA blends as determined by TGA.
Figure 10. DSC traces recorded (a) during cooling and (b) second heating (10 °C/min) of PLA(NA), PA12 and their blends.
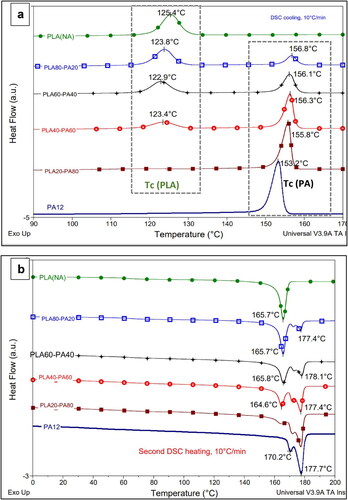
Table 6. Quantification of DSC data following the characterization of PLA(NA), PA12 and their blends.
Figure 11. DSC traces recorded during cooling (a) and second heating (b) of PLA60–PA40 blends with/without compatibilizers.
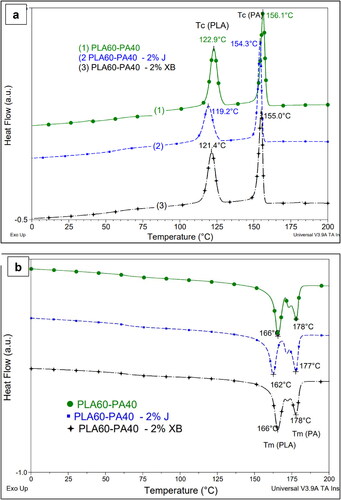
Figure 12. SEM images of PLA(NA)/PA12 60/40 wt.% with and without compatibilizers: (a, c, e) “non-etched” samples and (b, d, f) “etched” samples* in chloroform.
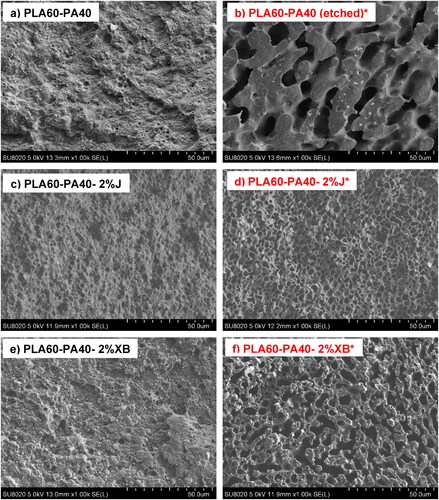
Table 7. Comparative mechanical propertiesa of PLA(NA), PA12, and PLA(NA)/PA (50/50%.vol) blends with/without 2% Joncryl.
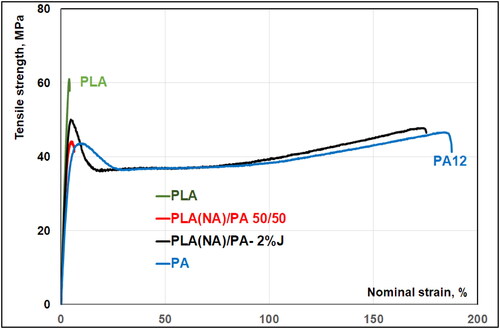
Figure 13. Tensile strength–strain curves obtained following the mechanical characterization of PLA(NA), PA12, and PLA(NA)/PA (50/50 % vol.) blends with/without 2% Joncryl.