Figures & data
Figure 1. FE-Model for heat source calibration.
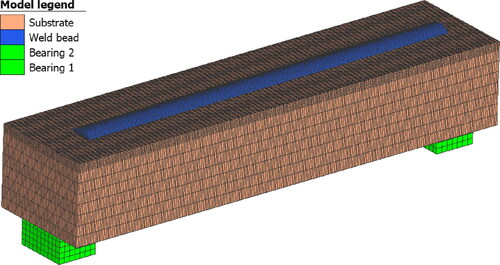
Table 1. Chemical composition in mass% of modified C55 (EN ISO 683-1, Citation2018) and 3Dprint AM 80 HD (Voestalpine Böhler Welding Austria GmbH, Citation2023) nominal according to datasheet.
Figure 2. Double elliptical Goldak heat source model (Rubio-Ramirez, Giarollo, Mazzaferro, & Mazzaferro, Citation2021).
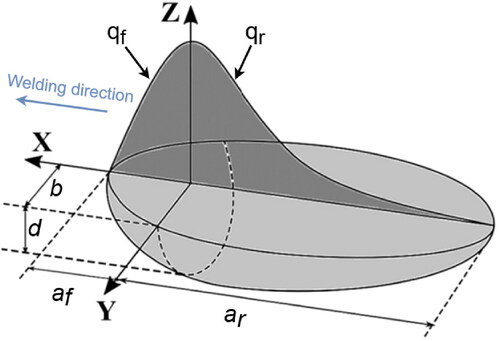
Figure 3. Gaussian heat source model.
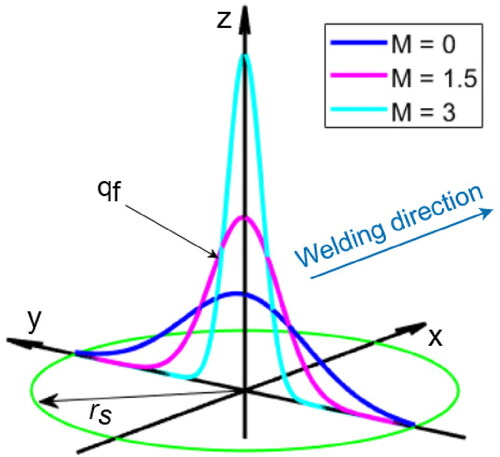
Table 2. Welding parameters for experiment.
Figure 4. Cross-sectional micrograph transvers to weld seam.
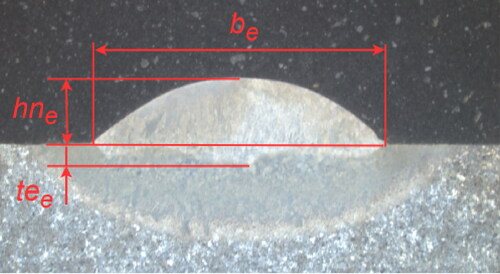
Figure 5. Deviation of the simulation from the experimentally determined melt pool geometry (double elliptical heat source).
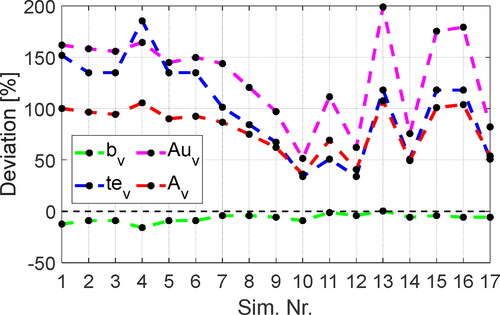
Figure 6. Deviation of the simulation from the experimentally determined melt pool geometry (Gaussian heat source).
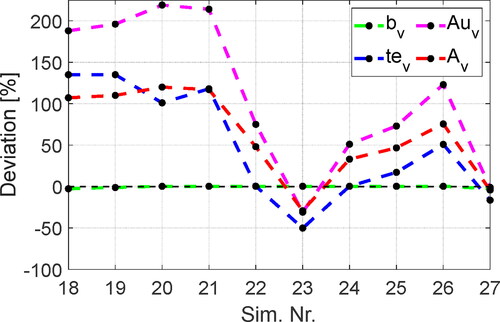
Figure 7. Temperature profiles simulation no. 27 and experiment.
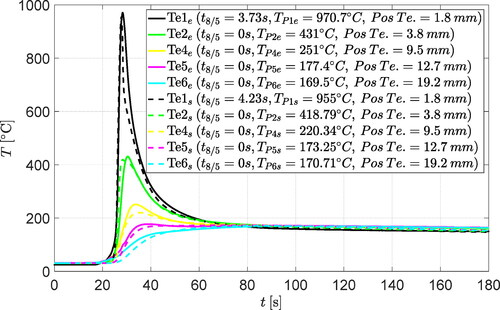
Table 3. Heat source parameters.
Figure 8. 3D temperature field validated heat source.
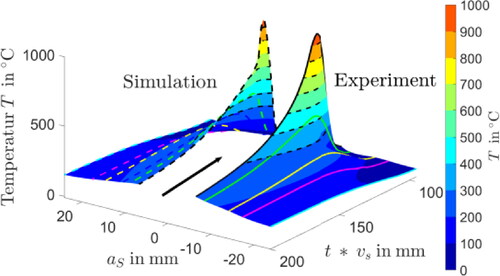
Figure 9. (a) Isothermal temperature field, (b) transverse temperature distribution.
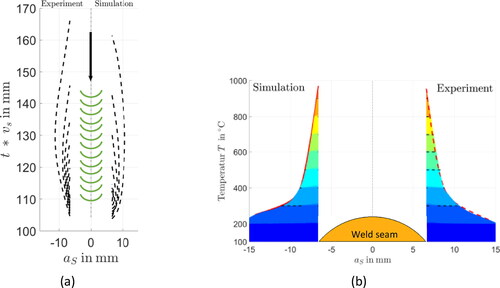
Figure 10. Surface deviation 4 times magnified.
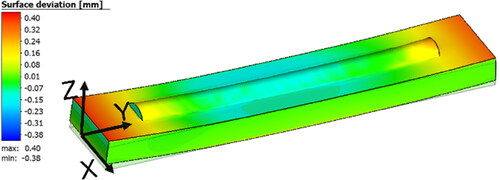
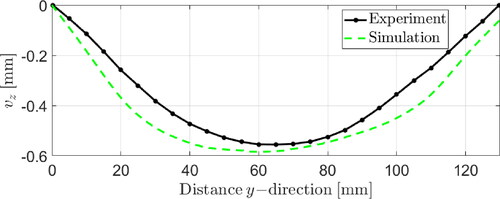
Figure 11. Comparison of distortion on sample backside.