Figures & data
Table 1. List of materials.
Figure 1. (a) SEM of cotton powder at 700x (b) SEM of cotton powder at 1200x.
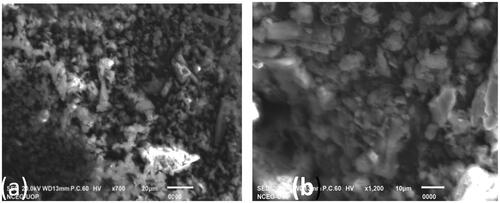
Figure 2. (a) SEM of CHX coated cotton powder at 750x (b) SEM of CHX coated cotton powder 1000x.
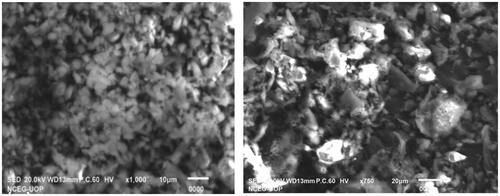
Figure 3. (a) Cotton, CHX, and CHX coated cotton powder.
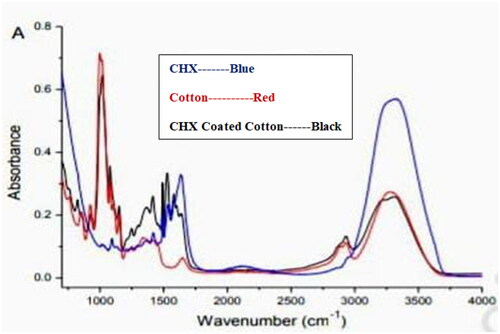
Figure 4. Flexural strength comparisons between Control group (C) and experimental groups (S1, S2, S3). The calculated mean flexural strength values with standard deviation error bars are expressed.
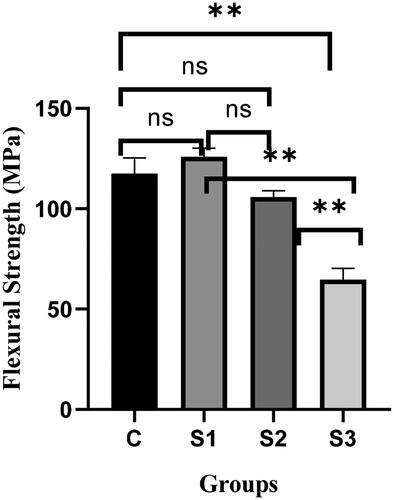
Figure 5. Compressive strength comparisons between Control group (C) and experimental groups (S1, S2, S3). The calculated mean compressive strength values with standard deviation error bars are expressed.
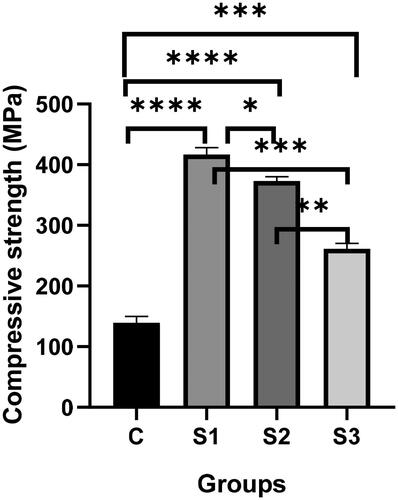
Figure 6. Graphical presentation of mean percent mass change (%) of group C and experimental groups (S1. S2, S3), after 1 day., 3 days, 7 days, and 10 days. The calculated mean % mass change values along with standard deviation error bars are expressed for group C and experimental groups (S1, S2, S3).
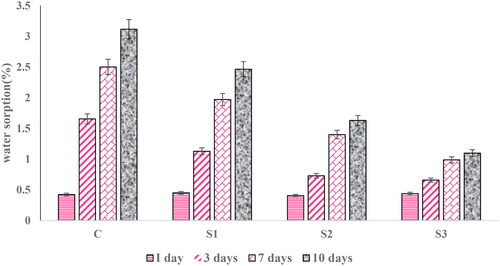
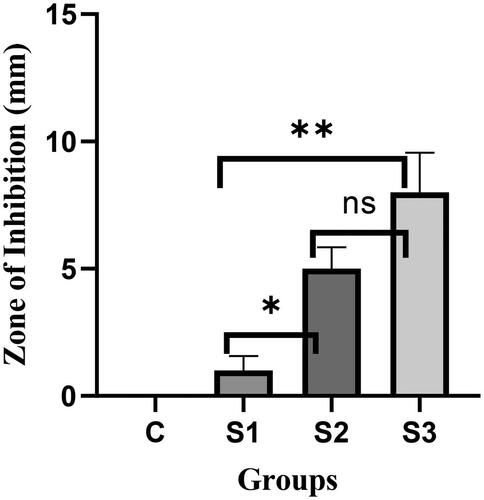
Figure 7. Graphical presentation of the mean zone of inhibition (mm) with standard deviation error bars for control group C and experimental groups S1, S2 &S3 after 24 hrs.