Figures & data
Table 1. Comparison of general data.
Figure 1. Serum HMGB1 expression in the three groups of patients. Serum HMGB1 expression in the control group (CG) of patients was lower than that in the mild group (MG) and the severe group (SG). Serum HMGB1 expression in MG patients was significantly lower than that in SG patients (*P < 0.05).
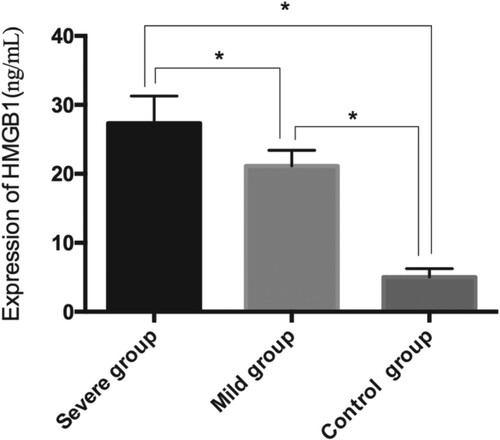
Table 2. Immune related indicators of the three groups of patients.
Figure 2. Comparison of APACHE II and MODS scores in the study group patients. Patients in the mild group (MG) had significantly lower APACHE II scores and MODS scores than those in the severe group (SG). * indicates P < 0.05.
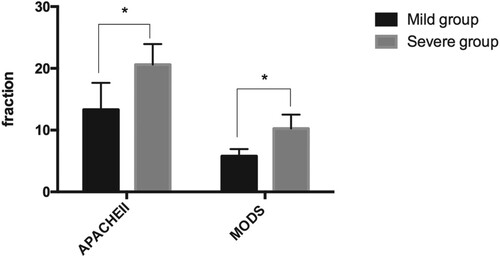
Figure 3. Correlation analysis between serum HMGB1 expression and APACHE II score in patients with sepsis. There was a positive correlation between serum HMGB1 expression and APACHE II score in patients with sepsis (r = 0.681, P < 0.05).
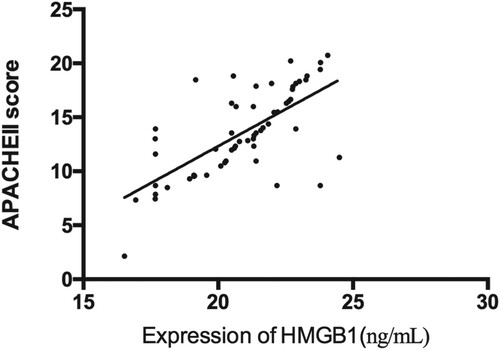
Figure 4. Correlation analysis between serum HMGB1 expression and MODS score in patients with sepsis. There was a positive correlation between serum HMGB1 expression and MODS score in patients with sepsis (r = 0.746, P < 0.05).
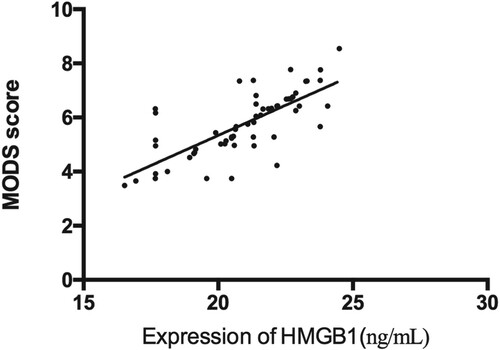
Figure 5. Correlation analysis between serum HMGB1 expression and hs-CRP. There was a positive correlation between serum HMGB1 expression and hs-CRP in patients with sepsis (r = 0.758, P < 0.05).
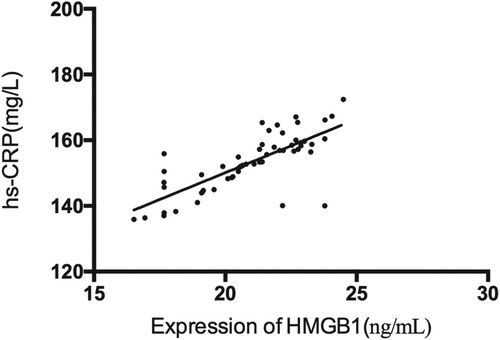
Figure 6. Correlation analysis between serum HMGB1 expression and leukocyte. There was a positive correlation between serum HMGB1 expression and leukocyte in patients with sepsis (r = 0.786, P < 0.05).
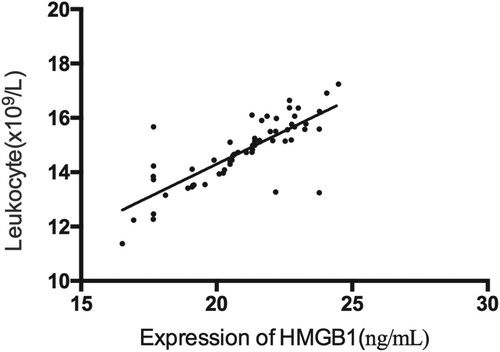
Figure 7. Relationship between serum HMGB1 expression and prognosis in patients with sepsis. Patients were divided those who died (n = 68) and those who survived (n = 44) within 28 days after admission. Serum HMGB1 expression was lower in the survivors than in those who died (*P < 0.05).
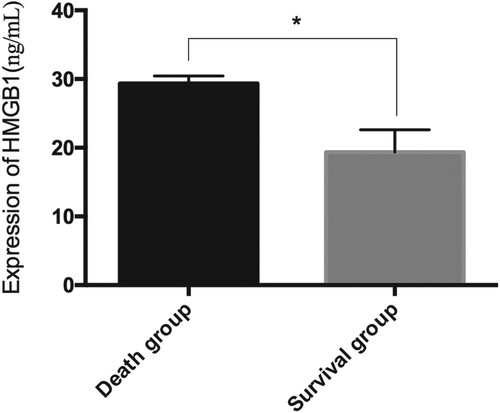
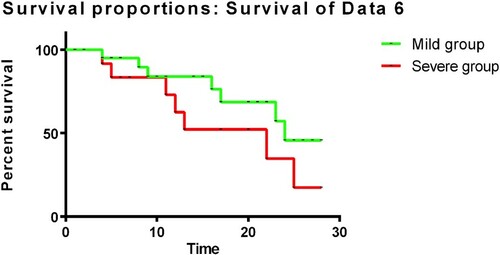
Figure 8. Comparison of survival rates between patients in the mild and severe sepsis groups. The 28-day survival rate was higher in the mild sepsis group than in the severe sepsis group (P < 0.05).