
Figures & data
Table 1. The primers for the quantitative real-time PCR.
Figure 1. Overall survival rate and time to androgen-independent prostate cancer in prostate cancer patients according to the expression or serum levels of miR-337-3p. (A) The time to androgen-independent prostate cancer in prostate cancer patients according to expression or serum levels of miR-337-3p. The left panel indicates a longer time to androgen-independent prostate cancer in patients with a higher expression of miR-337-3p in the cancer tissues than in those with a lower expression. The right panel indicates a longer time to androgen-independent prostate cancer in patients with higher serum levels of free miR-337-3p than in those with lower serum levels. (B) The similar 3-year overall survival rate in two groups of prostate cancer patients according to the expression (left) or serum levels of miR-337-3p (right). (C) The 3-year progression-free survival in prostate cancer patients with higher expression (left) or higher levels of serum-free miR-337-3p compared with that in the other group (right). (D) The expression of miR-337-3p measured by quantitative real-time PCR in the cancer tissues from androgen-sensitive (n = 33) and androgen-resistant (n = 27) prostate cancer patients. Survival curve and Log-rank test were used for the statistical description and analysis. In each group for survival analysis, n = 65. P < 0.05 indicate statistical significance.
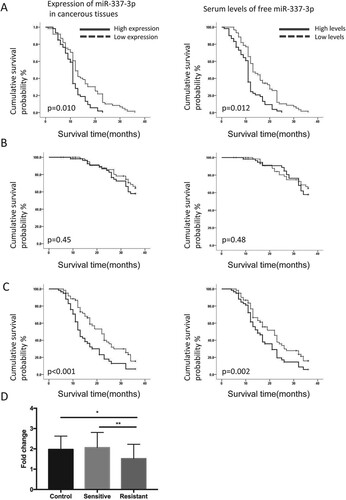
Figure 2. The mimics or inhibitors of miR-337-3p influence cellular proliferation and apoptosis. (A). Results of the MTT assay showing cell growth and viability under stimulation by different androgen concentrations as measured by optical density (OD) at 490 nm. Repeated measurement analysis of variance was used for statistical analysis. (B) The expression of apoptotic proteins measured using western blot in LNCap cells after treatment with mimics or inhibitors of miR-337-3p. The mimics significantly promoted the expression of caspase-3 and caspase-8 after androgen deprivation. (C) The results of transwell assays in LNCap cells after treatment with mimics or inhibitors of miR-337-3p. (D) The results of wound healing test in LNCap cells after treatment with mimics or inhibitors of miR-337-3p. Student’s t-test was used for the statistical analysis for graphs B–D. P < 0.05 indicates statistical significance. *p < 0.05 and **P < 0.01 vs. scramble control. All in vitro experiments were repeated five times to exclude occasionality.
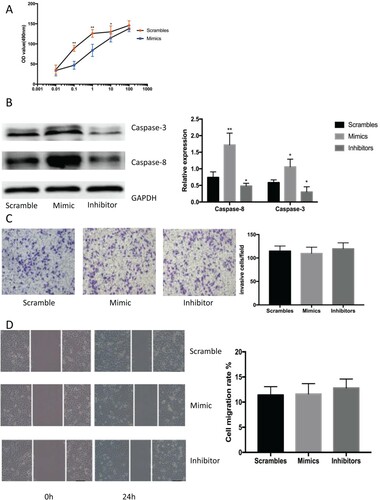
Figure 3. The target degeneration of PPARγ by miR-337-3p. (A) The identification of decreased expression of PPARγ after administration of mimics among all nominated genes with a decreased expression after treatment with mimics according to bioinformatic prediction. (B) The expression of PPARγ after administration of miR-337-3p scrambles, mimics, inhibitors and overexpression plasmids of PPARγ. (C) The results of dual luciferase reporter assays in the LNCap cells under the administration of mimics and inhibitors of miRNA-337-3p. The ratio of Firefly’s enzymatic activities to background value was used for the measurement of luciferase activities. (D and E) The representative immunoblot figures (D) and quantitative analysis (E) on the expression of apoptotic proteins measured by immunoblot assays under the administration of scramble controls, mimics, and mimics in combination with PPARγ overexpressing plasmid. Student’s t-test was used for the statistical analysis. P < 0.05 indicates statistical significance. *p < 0.05 and **P < 0.01 vs. scramble control. All in vitro experiments were repeated five times to exclude occasionality.
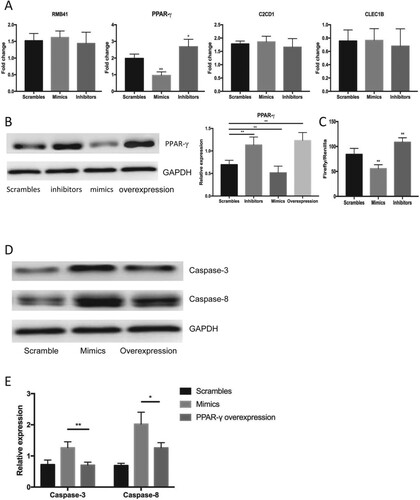
Figure 4. miR-337-3p inhibitor promoted autophagy through the AMPK signaling. (A) miR-337-3p inhibitor promoted the expression of LC3-II and led to a higher ratio of LC3-II to LC3-I in the LNCap cells. (B) miR-337-3p mimics inhibited the expression of PPARγ and LC3-II, leading to a lower ratio of LC3-II to LC3-I in the LNCap cells, but the overexpression of PPARγ reversed the inhibition of autophagy. (C) The inhibition of miR-337-3p or overexpression of PPARγ promoted the expression of PPARγ and phosphorylation of AMPK but did not influence the phosphorylation of mTORC1 in the LNCap cells. (D) The compound C (AMPK inhibitor) aggravated the apoptosis after administration of inhibitors or overexpression of PPARγ in the LNCap cells. Student’s t-test was used for the statistical analysis. P < 0.05 indicates statistical significance. *p < 0.05 and **P < 0.01 vs. scramble control. All in-vitro experiments were repeated five times to exclude occasionality.
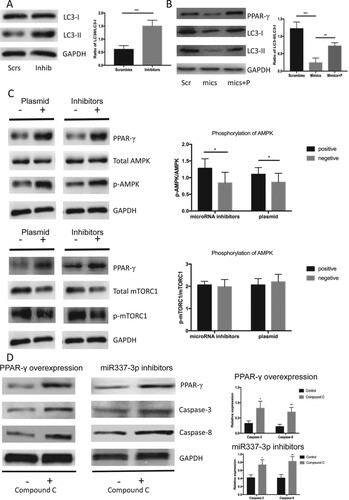
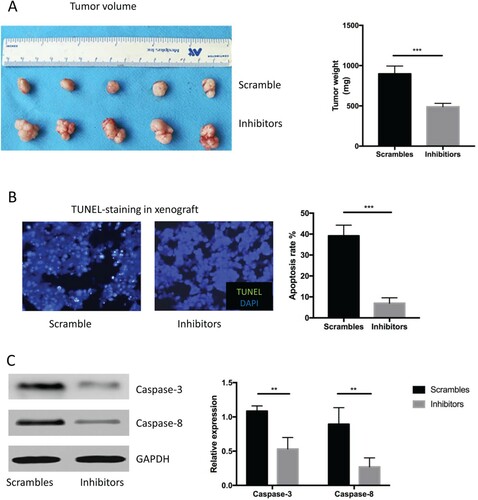
Figure 5. miR-337-3p inhibitor resulted in larger tumor volume in the in vivo xenograft experiments. (A) Representative figures of tumor volume and quantitative analysis of tumor weight in the xenograft with an adenovirus vector expressing miR-337-3p inhibitors or controls. (B) Representative figures and semi-quantitative analysis of TUNEL staining in the xenograft. (C) The expression of caspase-3 and caspase-8. Student’s t-test was used for the statistical analysis. P < 0.05 indicates statistical significance. *p < 0.05 and **P < 0.01 vs. scramble control. All in vitro experiments were repeated five times to exclude occasionality.
Data availability statement
The datasets used and/or analyzed during the current study are available from the corresponding author on reasonable request.