
Figures & data
Figure 1. Data collected from areas in Punjab, Pakistan.
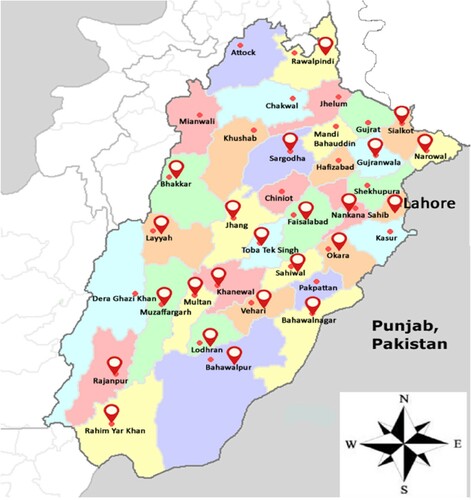
Table 1. Observed characters and traits in individuals.
Figure 2. Rolling Tongue.
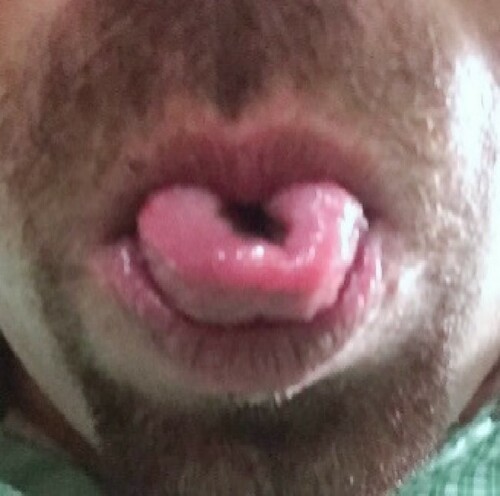
Figure 3. Non-Rolling Tongue
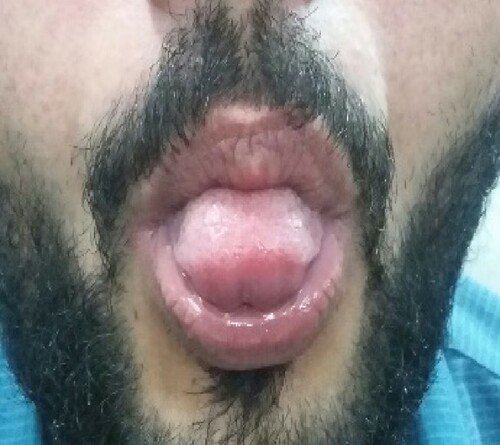
Figure 4. Attach Earlobe.
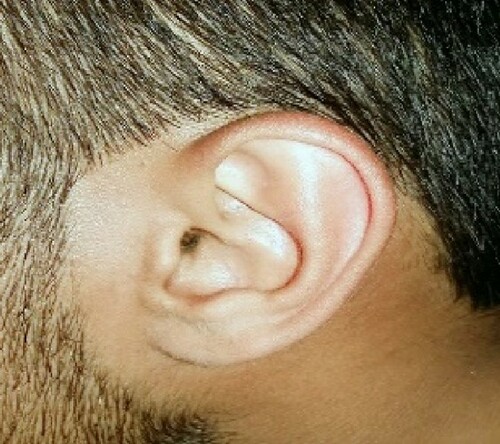
Figure 5. Free Earlobe.
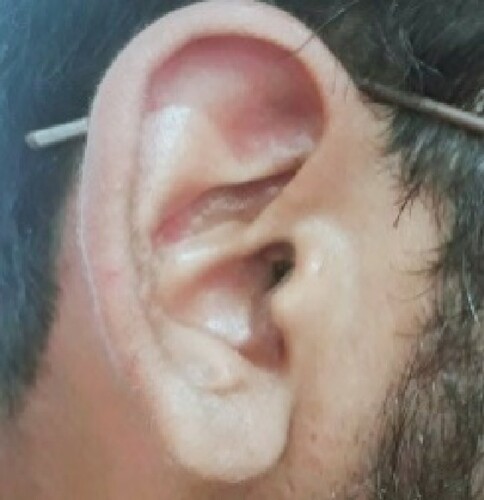
Figure 6. Straight Hair.
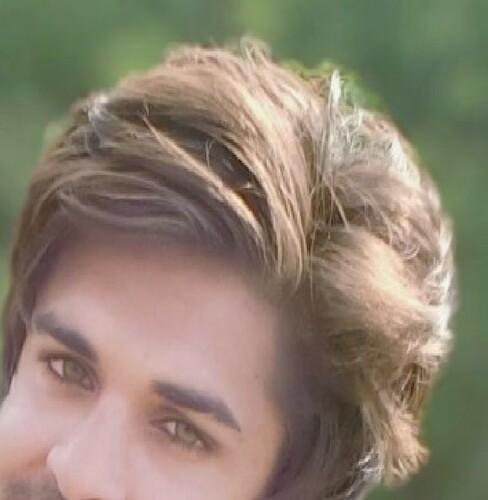
Figure 7. Wavy Hair.
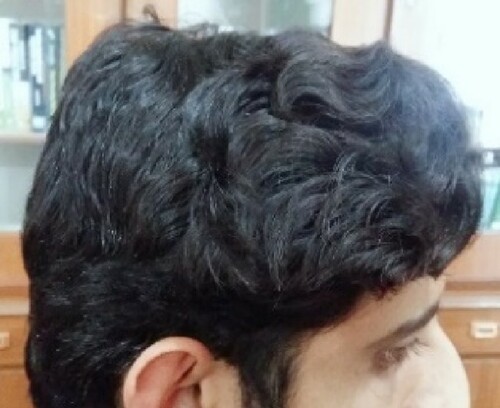
Figure 8. Curling Hair.
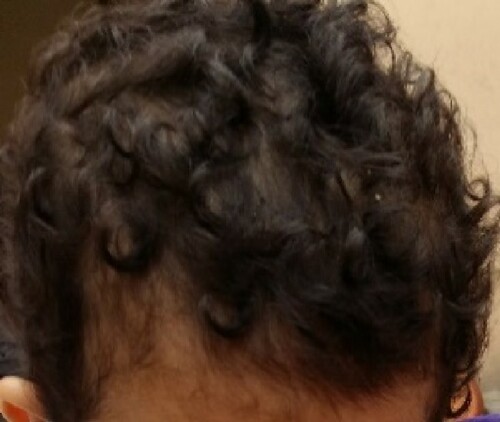
Figure 9. Dimple present.
Figure 10. Dimple Absent.

Figure 11. Sample size in percentage originated from different cities of Punjab. Other cities include Bahawalnagar, Bahawalpur, Bhakkar, Burewala, Layyah, Lodhran, Muzaffargarh, Narowal, Okara, Rahim Yar Khan, Rajanpur, Sahiwal, Toba Tek Singh, Vehari and Nankana sahib.
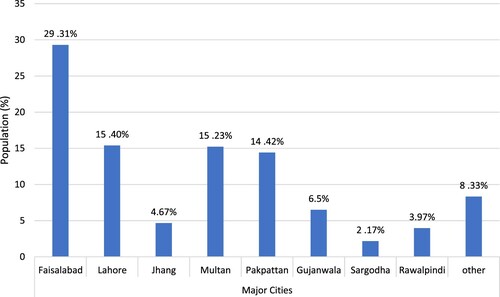
Table 2. Calculating the expected Mendelian phenotypic ratio for triallelic and diallelic characters in population.
Table 3. Percentage of different traits in population, males and females.
Table 4. Chi-square analysis and Allelic frequency of different traits of human characters in the whole population.
Table 5. Chi-square analysis and Allelic frequency of different traits of human characters in males.
Table 6. Chi-square analysis and Allelic frequency of different traits of human characters in females.
Data availability statement
The data that support the findings of this study are openly available in figshare at [https://doi.org/10.6084/m9.figshare.12014817.v1].