
Figures & data
Figure 1. LncRNA ENST433110 expression is decreased in TC cells and tissues. A, RT-PCR was used to evaluate lncRNA ENST433110 expression. B, Results are represented as the mean ± SEM of three independent experiments. **P < 0.01 vs. Nthy-ori 3-1. C, lncRNA ENST433110 expression was detected by quantitative real-time RT-PCR in TC and in normal tissues (normal). D-E, lncRNA-ROR expression and lncRNA00961 expression were detected by quantitative real-time RT-PCR in TC cells. Data are represented as the mean ± SEM, n = 7, **P < 0.01 vs. normal group.
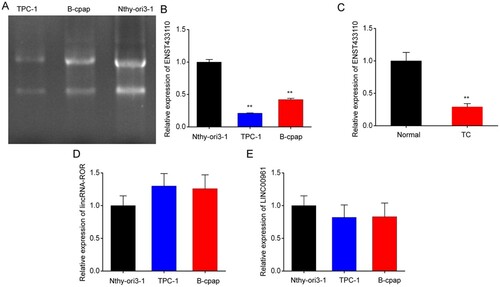
Figure 2. Overexpression of lncRNA ENST433110 suppresses TC cell proliferation. A and C, Expression of lncRNA ENST433110 in TPC-1 (A) and B-CPAP (C) cells after transient transfection with a lentivirus with the lncRNA ENST433110 plasmid (pLv-ENST433110) or lentivirus with an empty vector (pLv-NC). B and D, MTT assay to evaluate the effect of lncRNA ENST433110 overexpression on TPC-1 (B) and B-CPAP (D) cell proliferation. E and F, Cell cycle phase distribution was analyzed by flow cytometry in TPC-1 (E) and B-CPAP (F) cells. Data are represented as the mean ± SEM of three independent experiments. *P < 0.05, **P < 0.01 vs. pLv-NC.
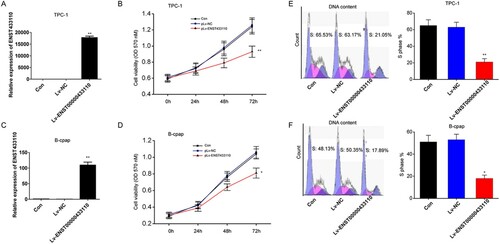
Figure 3. Overexpression of lncRNA ENST433110 suppresses TC cell migration. A–C, (A) Transwell assay was used to evaluate the effect of lncRNA ENST433110 overexpression on TPC-1 (B) and B-CPAP (C) cell migration. Representative images are shown. Scale bars = 100 µm. Data are represented as the mean ± SEM of three independent experiments. **P < 0.01 vs. pLv-NC.
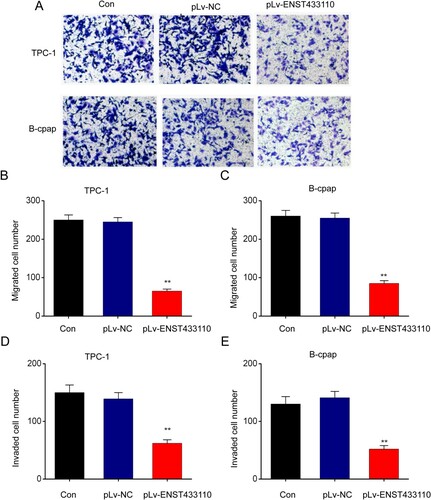
Figure 4. Overexpression of lncRNA ENST433110 enhances TC cell apoptosis. A–D, Flow cytometry was used to determine the effect of lncRNA ENST433110 overexpression on TPC-1 (A, B) and B-CPAP (C, D) migration. Representative images are shown. Scale bars = 100 µm. Data are represented as the mean ± SEM of three independent experiments. **P < 0.01 vs. pLv-NC.
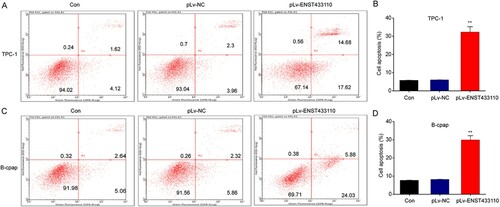
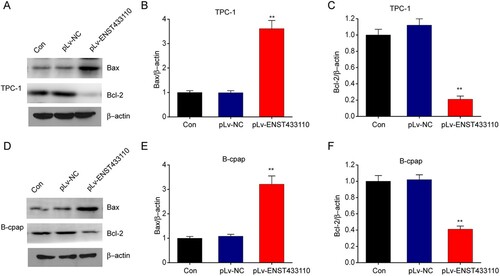
Figure 5. Overexpression of lncRNA ENST433110 regulates Bcl-2 and BAX expression in TC cells. A–F, Representative immunoblots and quantification of Bcl-2 and BAX expression in TPC-1 (A–C) and B-CPAP (D–F) cells. Data are represented as the mean ± SEM of three independent experiments. **P < 0.01 vs. pLv-NC.
Data availability statement
Due to the nature of this research, participants of this study did not agree for their data to be shared publicly, so supporting data is not available.