Figures & data
Table 1. The composition of the diet for the experimental rats.
Table 2. Primers used for quantitative real-time polymerase chain reaction (qPCR).
Figure 1. Effects of the individual or combination treatment with Spirulina platensis and green coffee bean aqueous extract anthropometric measurements, daily food intake. liver and subcutaneous WAT weights of HFD-induced obese rats (A-H). A. Body weight change, B. Final body weight change (left panel) and final body wight (right panel), C. Daily food intake, D. BMI, E. Abdominal circumference, F. subcutaneous WAT weight, G. liver weight, and H. Hepatosomatic index. Values are represented as mean ± standard error of mean (SEM) in each group (n = 8–10). The means bearing different superscripts are significantly different (P < 0.05).
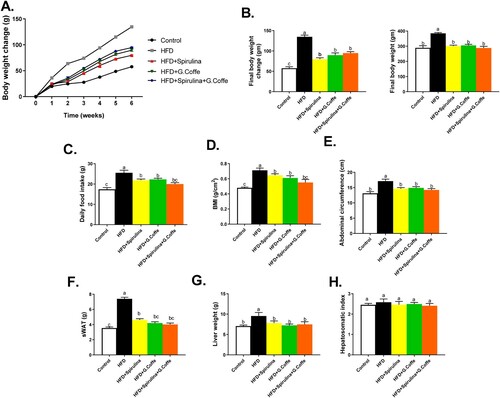
Table 3. Effects of the individual or combination treatment with Spirulina platensis and green coffee bean aqueous extract on liver function in HFD-induced obese rats.
Figure 2. Effects of the individual or combination treatment with Spirulina platensis and green coffee bean aqueous extracts on lipid profile in HFD-induced obese rats (A-E). A. Total cholesterol, B. Triacylglycerol, C. High-density lipoprotein-cholesterol, D. Low-density lipoprotein-cholesterol and Very low-density lipoprotein-cholesterol. Values are represented as mean ± standard error of mean (SEM) in each group (n = 8–10). The means bearing different superscripts are significantly different (P < 0.05).
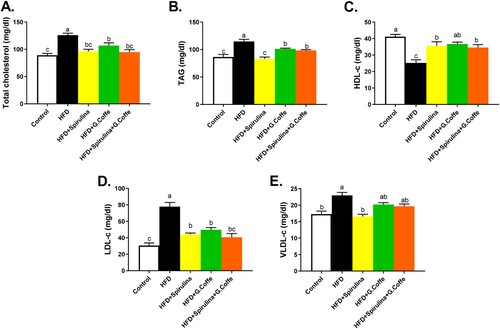
Table 4. Effects of the individual or combination treatment with Spirulina platensis and green coffee bean aqueous extract on the serum levels of leptin, insulin, and glucose in HFD-induced obese rats.
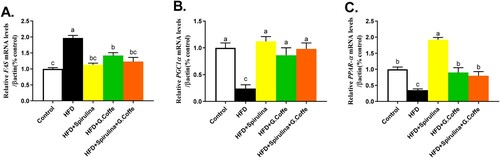
Figure 3. Quantitative real-time PCR analysis to determine the hepatic mRNA expression levels of FAS (A), PGC-1α (B), and PPARα (C) in the control, HFD (high-fat diet-fed group), Spirulina (HFD + Spirulina platensis extract-treated group), G. coffee (HFD + green coffee bean extract-treated group), and Cotreated (HFD + Spirulina platensis and green coffee bean extract-treated group) groups. Values are represented as mean ± standard error of mean (SEM) in each group. The means bearing different letters (a, b, and c) are significantly different (P < 0.05).