
Figures & data
Table 1. Primer sequences.
Figure 1. Expression of miR-233-3p and SOX6 mRNA in the myocardium of rats. The expression levels of miR-233-3p and SOX6 mRNA were not significantly different between the BCG and MSG (P > 0.05). The expression levels of miR-233-3p and SOX6 mRNA in the BCG and MSG were lower than those in the AMIG, IG, and NCG (P < 0.05). There was no significant difference in the expression levels of miR-233-3p and SOX6 mRNA between the AMIG and NCG (P > 0.05). However, miR-233-3p expression levels in the AMIG and NCG were higher than those in the IG (P > 0.05). * P < 0.05.
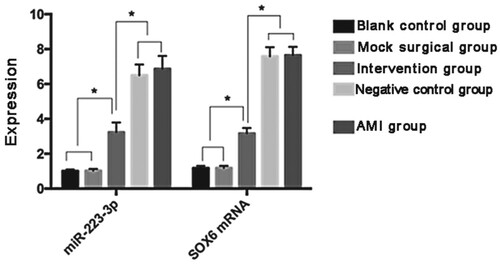
Table 2. Expression of miR-223-3p and SOX6 mRNA.
Figure 2. Comparison of cardiac function. LVEF and FS scores in the AMIG, IG, and NCG were lower than those in the BG and MSG (P < 0.05). The LVEF and FS scores in the IG were higher than those in the AMIG and NCG (P < 0.05). * P < 0.05.
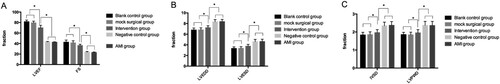
Table 3. Cardiac function 48 h after transfection with adenovirus.
Figure 3. Expression of miR-223-3p after transfection. The expression levels of miR-233-3p in the BG and NCG were higher than that in the TG (P < 0.05). * P < 0.05.
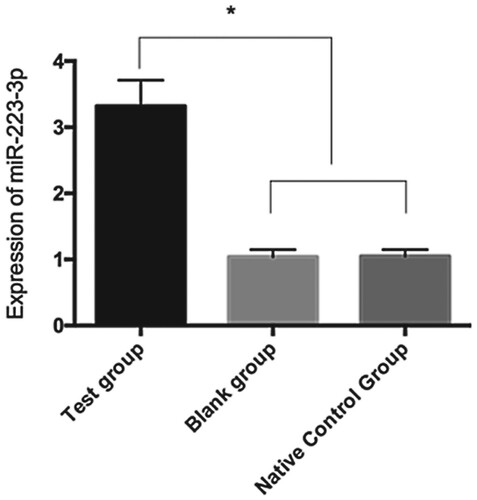
Figure 4. Expression of SOX6 and cardiomyocyte apoptosis-related proteins after transfection. The expression levels of SOX6 and BAX in the BG and NCG were lower than those in the TG (P < 0.05). The expression level of Bcl-xL was higher than that in the TG (P < 0.05). * P < 0.05.
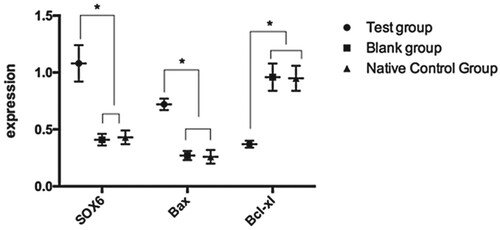
Figure 5. Apoptosis of cardiomyocytes after transfection. The cardiomyocyte apoptosis rates in the BG and NCG were lower than that in the TG (P < 0.05). * P < 0.05.
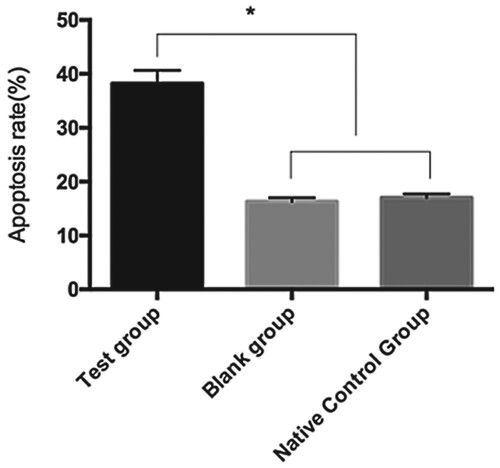
Figure 6. Overexpression of miR-223-3p on the luciferase activity of SOX6 3’UTR Wt and SOX6 3’UTR Mut (A) and expression of SOX6 protein in the cells transfected with miR-223-3p inhibitor (B). Overexpression of miR-223-3p further stimulated the luciferase activity of SOX6 3’UTR Wt (P < 0.05), but had no effect on the SOX6 3’UTR Mut. The expression of SOX6 protein in the cells transfected with miR-223-3p inhibitor was down-regulated. * P < 0.05.
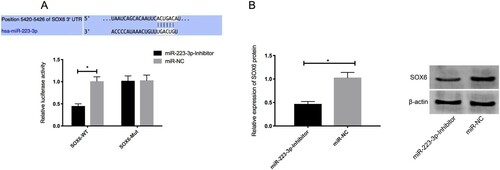
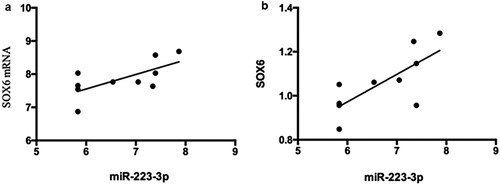
Figure 7. Correlation between the expression of miR-223-3p and SOX6 mRNA and protein. 7a:The expression levels of miR-223-3p and SOX6 mRNA were positively correlated (r = 0.683, P < 0.05).7b: Correlation between the expression of miR-223-3p and SOX6 protein. The expression of miR-223-3p was positively correlated with that of SOX6 protein (r = 0.740, P < 0.05).
Data availability statement
The data that support the findings of this study are openly available in figshare at http://doi.org/10.6084/m9.figshare.12301061.