
Figures & data
Figure 1. Flow diagram showing patient selection and grouping. Patients admitted to the ICU between January 2016 and December 2018 were assessed for possible enrollment. Of the 1479 ICU patients, 432 were enrolled on the basis of inclusion and exclusion criteria. Groups were categorized according to their baseline APACHE II score and UA concentration, with Group I including patients with APACHE II score <17.5 and UA concentration <296.27 µmol/L, Group II patients with APACHE II score <17.5 and UA concentration ≥296.27 µmol/L, Group III patients with APACHE II score ≥17.5 and UA concentration <296.27 µmol/L, and Group IV patients with APACHE II score ≥17.5 and UA concentration ≥296.27 µmol/L. Abbreviations: APACHE, Acute Physiology and Chronic Health Evaluation; UA, uric acid.
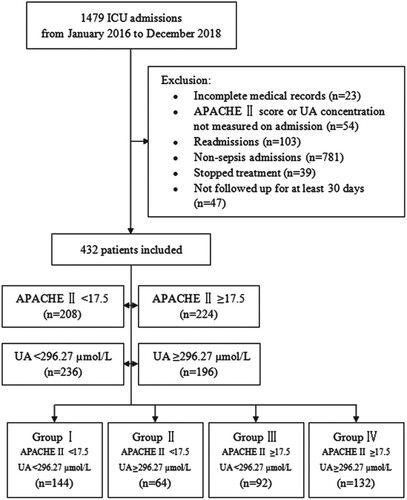
Table 1. Demographic, clinical, and biochemical characteristics of the four groups of patients stratified by baseline APACHE II score and UA concentration
Figure 2. ROC curves of APACHE II score (solid blue line), UA concentration (solid green line), and APACHE II score plus UA concentration (solid red line) as predictors of 30-day mortality in patients with sepsis. Abbreviations: APACHE, Acute Physiology and Chronic Health Evaluation; ROC, receiver operating characteristic; UA, uric acid.
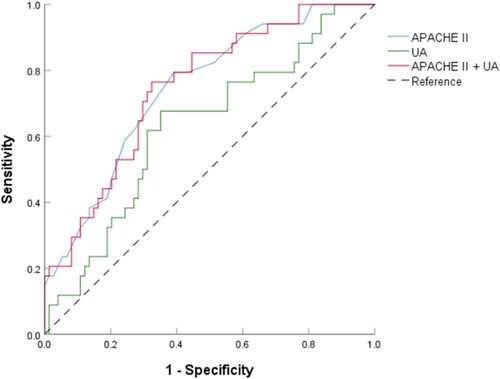
Table 2. Diagnostic ability of ROC curves for APACHE II score, UA concentration, and their combination for predicting 30-day mortality.
Figure 3. In-hospital mortality in the four groups of patients stratified by APACHE II score and UA concentration (P<0.001 by Chi-squared test for comparison among groups). Abbreviations: APACHE, Acute Physiology and Chronic Health Evaluation; UA, uric acid.
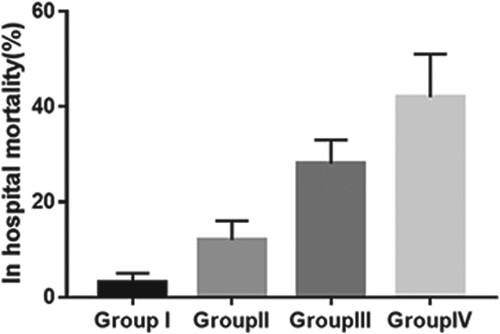
Figure 4. Kaplan-Meier analysis of cumulative 30-day mortality in the four groups of patients stratified by baseline APACHE II score and UA concentration (P<0.001 by log-rank test for overall comparison among groups). Group I: solid blue line; Group II: solid green line; Group III: solid red line, Group IV: solid purple line. Abbreviations: APACHE, Acute Physiology and Chronic Health Evaluation; UA, uric acid.
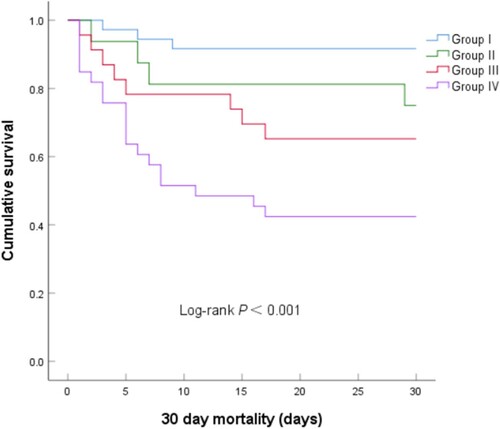
Table 3. Cox proportional hazards analyses for 30-day mortality in groups of patients stratified by baseline APACHE II score and UA concentration.
Data availability statement
Due to the nature of this research, participants of this study did not agree for their data to be shared publicly, so supporting data is not available.