
Figures & data
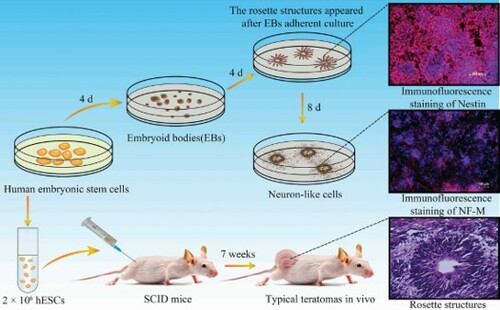
Figure 1. Neural differentiation of EBs in vitro. (A) Schematic for neural differentiation; (B) hESCs cultured on KM3 feeder; (C) EBs after suspending culture; (D) The rosette structures appeared after EBs adherent culture, the white arrows indicated rosette structures; (E-G) Immunofluorescence staining of Nestin in EBs; (H-J) Immunofluorescence staining of Nestin in rosette structures; (B-J: Scale bars = 100 µm).
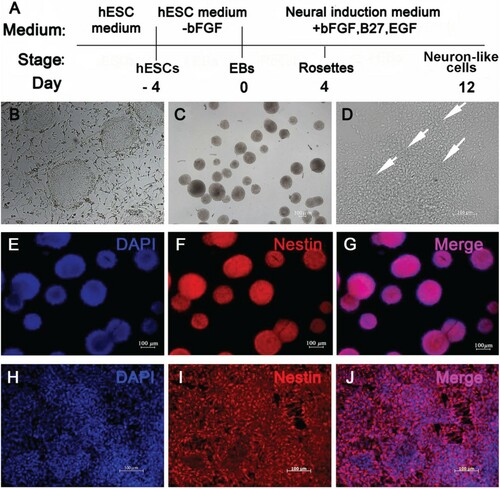
Figure 2. Formation of neural rosette structures at 7 weeks after hESCs injection into SCID mice. (A) Typical teratomas in vivo; (B) HE staining of the teratomas; (C) The white arrows indicated rosette structures; (D) The white arrows indicated rosette structure; (B: Scale bar = 200 µm; C: Scale bar = 100 µm; D: Scale bar = 50 µm).
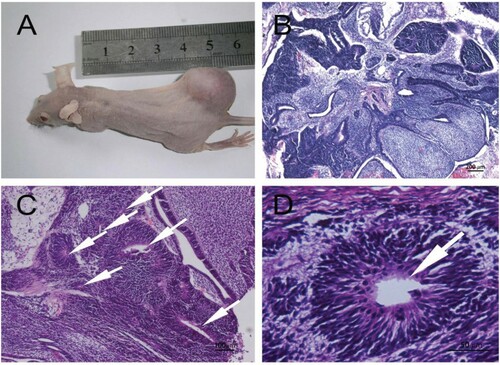
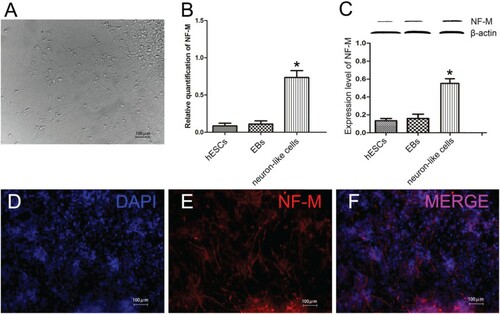
Figure 3. Neural differentiation of EBs in vitro for 12 days. (A) Neuron-like cells after EBs adherent culture; (B)The gene expression levels of NF-M; (C) The protein expression of NF-M; (D-F) Immunofluorescence staining of NF-M in neuron-like cells; (A, D-F: Scale bars = 100 µm; B, C: *P < 0.05, neuron-like cells compared with hESCs and EBs; β-actin: internal reference).
Data availability statement
Data and materials supporting the results or analysis presented in the paper are available free of charge.