
Figures & data
Table 1. Comparison between the two groups in general clinical characteristics n [%].
Table 2. Comparison of clinical efficacy between the groups n [%].
Table 3. Changes in liver function indicators before and after treatment (x ± SD).
Figure 1. Changes in HBV-DNA levels before and after treatment. While no differences were observed before treatment (P > 0.05), both groups demonstrated a decrease in HBV-DNA level after treatment (P < 0.05), and this change was more significant in the study group (P < 0.05).
Note: *P < 0.05 compared with conditions before treatment; #P < 0.05 compared with the study group after treatment.
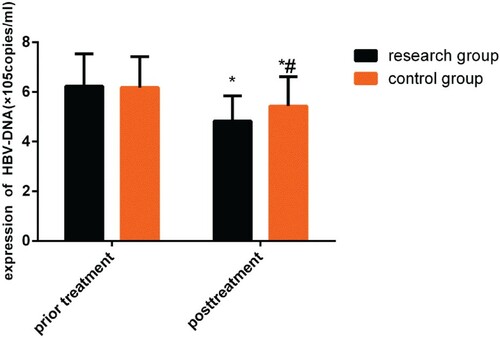
Figure 2. Comparison of KPS scores before and after treatment. While no differences were observed before treatment (P > 0.05), both groups demonstrated an increase in KPS scores after treatment (P < 0.05), and this change was more significant in the study group (P < 0.05).
Note: *P < 0.05 compared with conditions before treatment; #P < 0.05 compared with the study group after treatment.
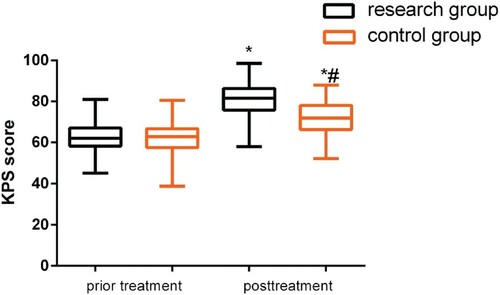
Figure 3. Comparison of survival rates. The study group had a 1-year survival rate of 87.60%, and the control group had a 1-year survival rate of 81.40% (P > 0.05). The study group had a 2-year survival rate of 75.19%, and the control group had a 2-year survival rate of 60.47% (P < 0.05).
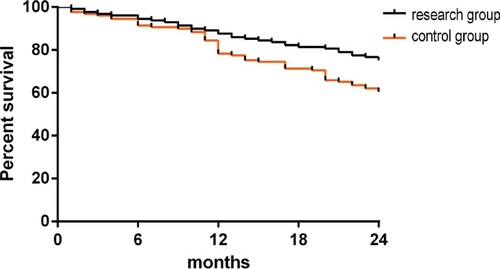
Table 4. Comparison of recurrence rate and LOS n [%].
Table 5. Comparison of the incidence of adverse reactions n [%].
Data availability statement
Due to the nature of this research, the participants of this study did not agree for their data to be shared publicly, so supporting data is not available.