
Figures & data
Figure 1. Schematic representation showing the experimental protocols used in the study. Hearts isolated from Wister rats were subjected to one of the following protocols (n = 8). (A) Sham, only canulation, stabilization and perfusion for 1 h. (B) Unprotected ischemia-reperfusion (control). (C) Hearts isolated from rats treated with DAF in drinking water for 4 weeks. (D) Hearts isolated from rats treated with DAF in drinking water for 2 weeks. (E) Hearts isolated from rats injected with intravenous DAF 2 h before sacrifice. (F) Hearts infused with DAF at the beginning of reperfusion.
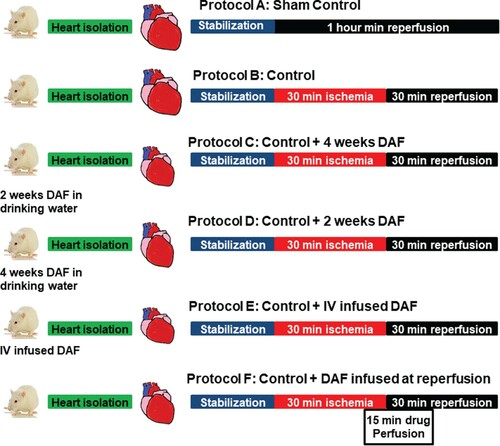
Figure 2. Left ventricle function (DPmax and LVEDP) and coronary vascular dynamics (CF and CVR) during post-ischemic recovery after DAF treatment protocols (n = 8). The data were computed after 30 min reperfusion and expressed as mean ± SEM. DPmax: maximum developed pressure; LVEDP: left ventricular end-diastolic pressure; CF: coronary flow; CVR: coronary vascular resistance; Ctr, control; DAF 2 h, Daflon infusion 2 h before sacrifice; DAF 2W, Daflon administration for 2 weeks; DAF 4W, Daflon administration for 4 weeks; Rep + DAF, Daflon infusion at reperfusion. *P < .05 compared with respective controls, **P < .01 compared with sham and †P < .05 compared with the ischemic period.
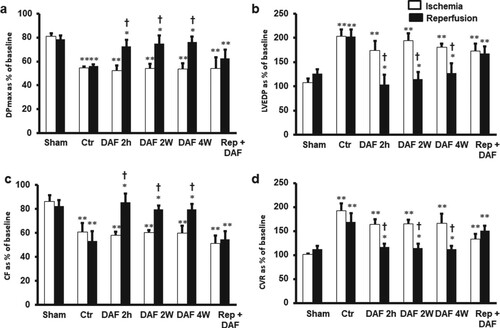
Table 1. Effects of ischemia/reperfusion and DAF treatment on heart contractility (+dP/dt and −dP/dt).
Figure 3. Infarct size after DAF treatment (n = 4). Top: representative 2,3,5-triphenyl-2H-tetrazolium chloride-stained heart slices for each treatment condition. Bottom: measured infarct size, normalized to the LV area, in isolated rat hearts at the end of reperfusion. Ctr, control; Rep, reperfusion; DAF 2 h, Daflon infusion 2 h before sacrifice; DAF 2W, Daflon administration for 2 weeks; DAF 4W, Daflon administration for 4 weeks. *P < .001 compared with respective controls.
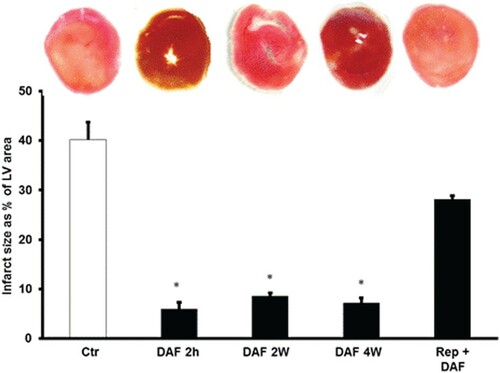
Figure 4. DAF effect on caspase-3 expression in the supernatants of homogenized left ventricles by immunoblotting (n = 4). (A) Western blot showing the expression of caspase-3 and (B) expression levels of caspase-3. Values are means ± SEM for 4 individual experiments. Ctr, control; DAF 2 h, Daflon infusion 2 h before sacrifice; DAF 2W, Daflon administration for 2 weeks; DAF 4W, Daflon administration for 4 weeks. *P < .05 compared with the respective controls.
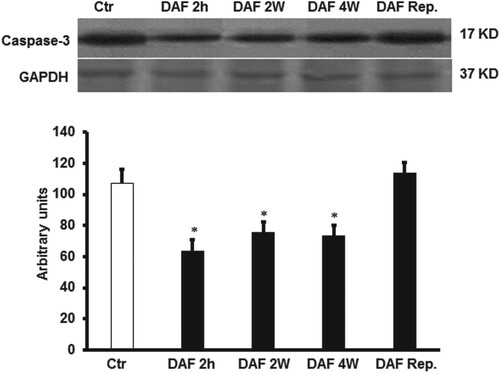
Table 2. Effects of ischemia/reperfusion and DAF treatment on cardiac enzymes.
Figure 5. Proinflammatory and anti-inflammatory cytokine levels in the cardiac muscle samples after DAF infusion for 2, 4 weeks, or 2 h before sacrifice or at reperfusion compared with those in the control group (n = 4). (A) DAF decreased the TNF-α protein levels, (B) decreased the IL-1 protein levels, (C) decreased the IL-6 protein levels and (D) had no effect on the anti-inflammatory cytokine IL-10 protein levels. Ctr, control; DAF 2 h, Daflon infusion 2 h before sacrifice; DAF 2W, Daflon administration for 2 weeks; DAF 4W, Daflon administration for 4 weeks. *P < .05 compared with the respective controls.
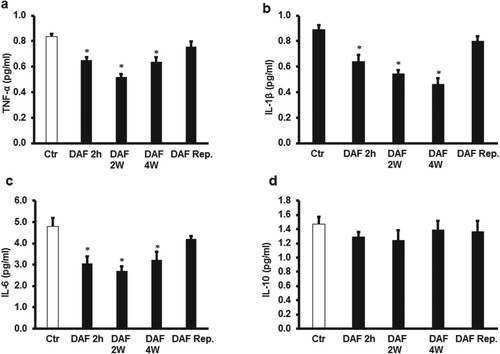
Figure 6. Estimation of oxidative stress in rat hearts. (A) Total oxidant and (B) total antioxidant levels in cardiac muscle samples after DAF administration for 2, 4 weeks, or 2 h before the animal sacrifice at the end of treatment period and before ischemia-reperfusion procedure compared with the levels in the control group (n = 4). Ctr, control; DAF 2 h, Daflon infusion 2 h before sacrifice; DAF 2W, Daflon administration for 2 weeks; DAF 4W, Daflon administration for 4 weeks. *P<0.05 compared with the respective controls.
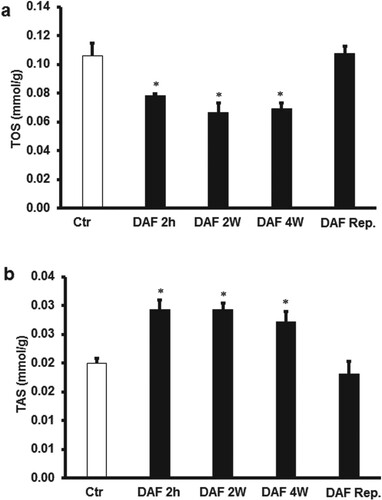
Figure 7. Estimation of oxidative stress in rat hearts. (A) Total oxidant and (B) total antioxidant levels in cardiac muscle samples after DAF administration for 2, 4 weeks, or 2 h before sacrifice or at reperfusion compared with the levels in the control group (n = 4). (C) Total oxidants levels in the effluent samples after DAF administration for 2, 4 weeks, or 2 h before sacrifice or at reperfusion compared with the levels in the control group. Ctr, control; DAF 2 h, Daflon infusion 2 h before sacrifice; DAF 2W, Daflon administration for 2 weeks; DAF 4W, Daflon administration for 4 weeks. *P < .05 compared with the respective controls.
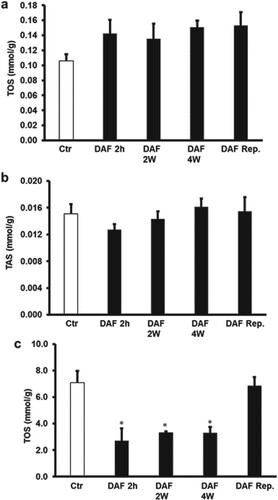
Figure 8 . Estimation of oxidative stress in rat hearts using SOD and CAT levels. (A) SOD in cardiac muscle samples after DAF administration for 2, 4 weeks, or 2 h before sacrifice or reperfusion compared with the levels in the control group (n = 4). (B) CAT in cardiac muscle samples after DAF administration for 2, 4 weeks, or 2 h before sacrifice or at reperfusion ompared with the levels in the control group (n = 4). SOD, superoxide dismutase; CAT, catalase; Ctr, control; DAF 2 h, Daflon infusion 2 h before sacrifice; DAF 2W, Daflon administration or 2 weeks; DAF 4W, Daflon administration for 4 weeks. *P < .05 compared with the respective controls.
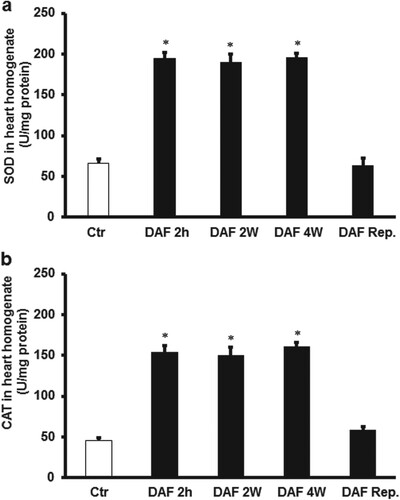
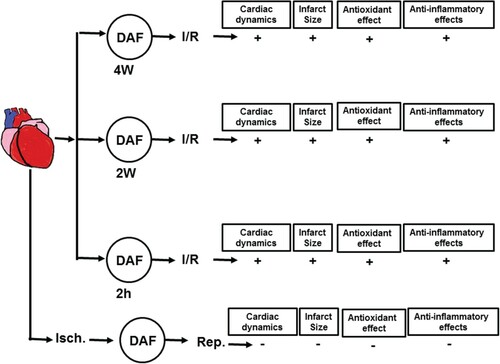
Figure 9. Schematic representation showing the protective effects of DAF observed in this study (n = 8) for hemodynamics and (n = 4) for infarct size, antioxidants effects and anti-inflammatory. Ctr, control; Isch., ischemia; Rep., reperfusion; AF 2 h, Daflon infusion 2 h before sacrifice; DAF 2W, Daflon administration for 2 weeks; DAF 4W, Daflon administration for 4 weeks.
Data availability statement
The authors confirm that the data supporting the findings of this study are available at this data repository: https://dataverse.harvard.edu/dataset.xhtml?persistentId=doi%3A10.7910%2FDVN%2FPOK8ES&showIngestSuccess=true&version=DRAFT.