
Figures & data
Figure 1. Toluidine blue staining. A. Morphology of undifferentiated hWJSCs in basal media only with no supplement (negative control). Chondrogenic differentiation of hWJSCs was analyzed by toluidine blue staining of proteoglycans (black arrow) after 3 weeks of cultivation in chondrogenic basal media with chondrogenic supplement contains; B. 5 mM glucose (control), C. HG, D. RSV, E. HG-RSV. Scale bars represent 50 μM.
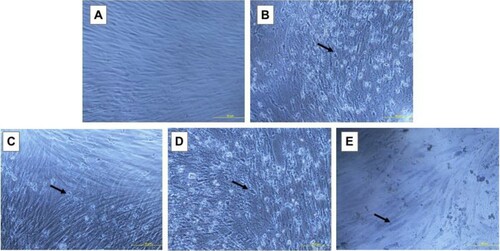
Figure 2. Relative differentiated cell (DC) proliferation using WST-1 assay. The cells were cultured in chondrogenic supplemented medium following treatment with HG, RSV, or HG-RSV. The WST-1 proliferation analysis was performed at 4,14, and 21 days. The values are expressed as mean ± SEM, n = 3. *P < 0.05, **P < 0.01, ***P < 0.001, ****P versus control, #P < 0.05 versus HG.
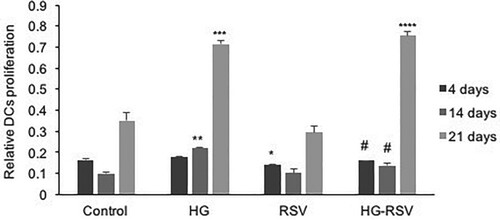
Figure 3. Quantitative real-time gene expression analysis of chondrogenic specific genes. The mRNA expression of A. COLI, B. COLII, C. COLX, and D. SOX9 was measured in chondrogenic differentiated cells after 2 weeks of treatment with HG, RSV, or HG-RSV. Beta-actin was used as an internal control. The values are expressed as mean ± SEM, n = 3. *P < 0.05, **P < 0.01, ***P < 0.0001 versus control.
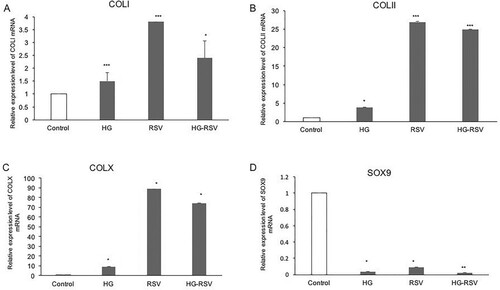
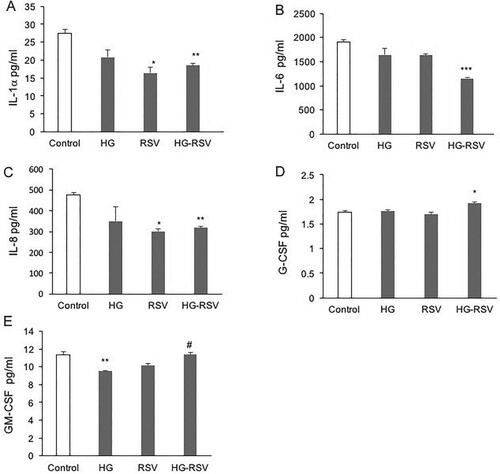
Figure 4. Expression levels of secreted pro-inflammatory cytokines in the chondrogenic differentiated cells supernatant. Cell culture supernatant was collected after 2 weeks of chondrogenic differentiation under treatment conditions with HG, RSV, or HG-RSV and analyzed using multiplex cytokine assay. The following cytokines were quantified namely A. IL-1α, B. IL-6, C.IL-8, D. G-CSF, and E. GM-CSF. The values are expressed as mean ± SEM, n = 3. **P < 0.01 versus control, #P < 0.05 versus HG.
Data availability statement
The authors confirm that the data supporting the findings of this study are available within the article.