Figures & data
Table 1. Intergroup comparison of basic materials.
Figure 1. Intergroup comparison of results of blood gas analysis.
Note: *p < 0.05 vs conditions before treatment; #p < 0.05 vs OG after treatment.
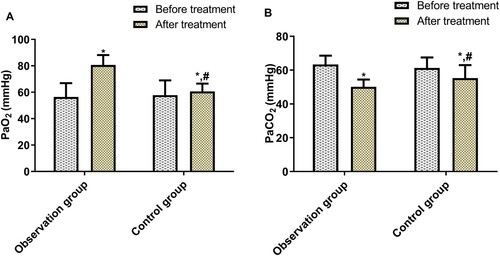
Figure 2. Intergroup comparison of PF indexes.
Note: *p < 0.05 vs conditions before treatment; #p < 0.05 vs OG after treatment.
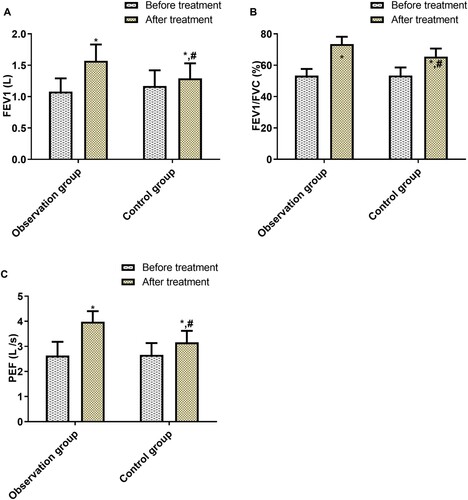
Table 2. Intergroup comparison of efficacy.
Table 3. Intergroup comparison of incidences of adverse reactions.
Table 4. Intergroup comparison of SGRQ scores before and after treatment.
Table 5. Intergroup comparison of time to improve clinical symptoms (d).
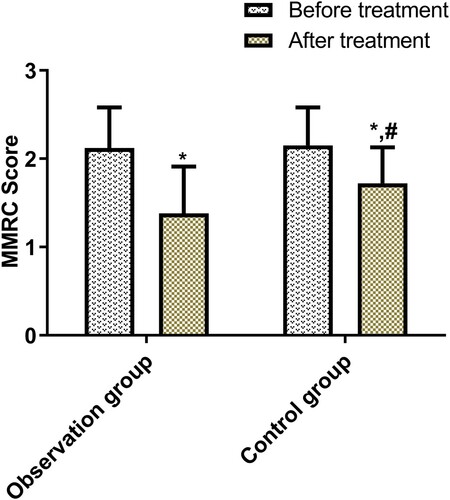
Figure 3. Intergroup comparison of MMRC before and after treatment.
Note: *p < 0.05 vs conditions before treatment; #p < 0.05 vs OG after treatment.