
Figures & data
Table 1. The demography and clinical indexes in different ethnic populations with or without CAD.
Table 2. The clinical indexes in different ethnic populations classified by the serum FPG levels.
Figure 1. The Gensini scores in different ethnic groups classified by the serum FPG. P < .001 compared to normal individuals (FPG < 5.6 mmol/L).
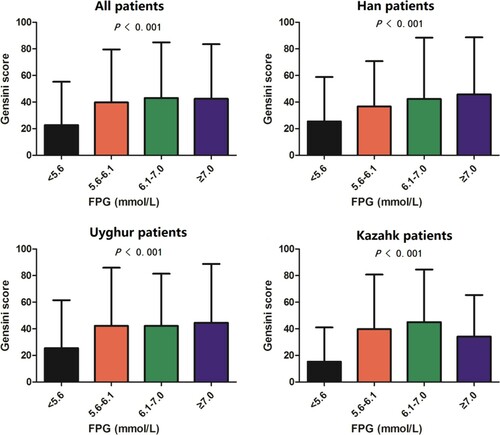
Figure 2. The correlation between serum FPG and Gensini scores in different ethnic groups estimated by Pearson analysis.
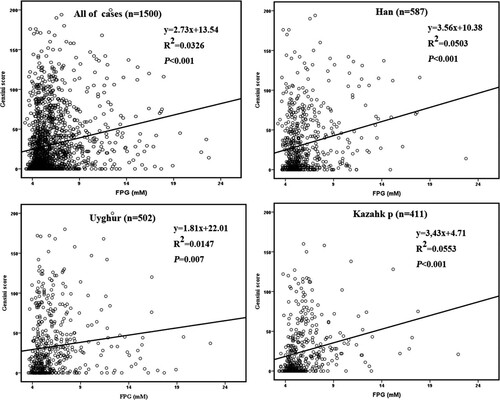
Table 3. Logistic regression analysis the risk of CAD.
Data availability statement
Due to the nature of this research, participants of this study did not agree for their data to be shared publicly, so supporting data is not available.