
Figures & data
Table 1. Sequence of primers.
Figure 1. The effects of cON injury on brain glucose metabolism of the right and left region of interest over time. The cON injury induced region-specific changes in glucose metabolism as compared with the baseline (0 weeks) in the visual cortex (A) and thalamus (B). The SUVR of the right visual cortex was higher than that of the left visual cortex during the 5-week experimental period, with a significant difference observed in the PET image on the second week (A). The SUVR significantly increased in both thalami at 2 weeks post-surgery compared with the baseline as determined using PET images. No significant difference was observed between the right and left thalamus (B). The SUVRs of the hypothalamus (C) and superior colliculus (D) were not changed. SUVR is defined as the normalized SUV of each region with the SUV of the medulla of the same animal. Data are shown as mean±SEM. *P < 0.05, comparing ROIs of the right and left cerebral hemispheres, respectively. ∧P < 0.05, both sides of the ROIs compared with the baseline study of PET at 0 week.
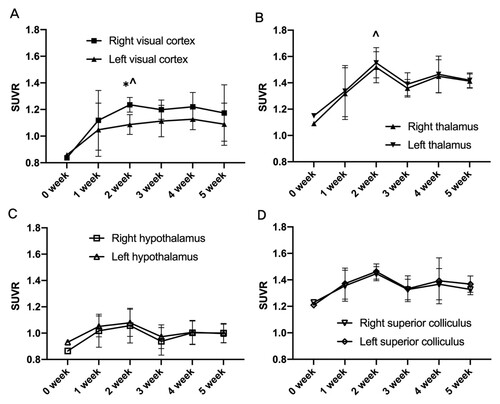
Figure 2. Asymmetricity of glucose metabolism in each ROI over time. The ratio of glucose metabolism in the right and left visual cortices changed, with a maximum at 2 weeks post-surgery. The other regions, such as the thalamus, hypothalamus, and superior colliculus showed similar activity in both right and left sides.
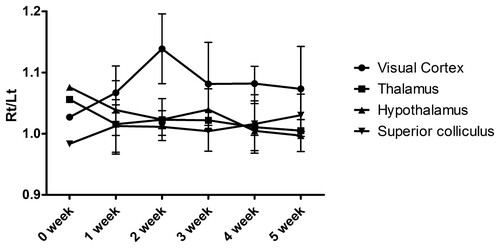
Table 2. Lesion based analysis of changes in ratio of SUVR (Right/Left).
Figure 3. Cross-hemispheric correlations in glucose metabolism in the visual cortex. Significant cross-hemispheric correlations were found at the preoperative examination in the first, fourth, and fifth week after surgery.
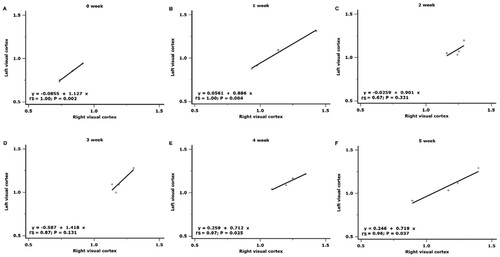
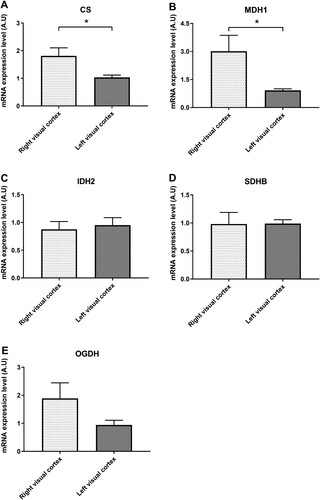
Figure 4. Differences in enzymes of the tricarboxylic acid (TCA) cycle. The levels of citrate synthase (CS, A) and malate dehydrogenase I (MDHI, B) significantly increased in the right visual cortex. The isocitrate hydrogenase (IDH2, C) and succinate dehydrogenase complex iron sulfur subunit B (SDHB, D) did not show any difference in the right and left visual cortices. The level of oxoglutarate dehydrogenase (OGHD) increased in the right visual cortex without statistical significance (E).
Data availability statement
Data and materials supporting the results or analyses presented in this study freely available. The name of dataset is ‘TONP_Dataset.xlsx’ which is assessable via https://osf.io/eturg.