
Figures & data
Figure 1. Establishment of PIPNP. Mechanical (a) and thermal tests (b) in PIPNP rats. Body weight (c) and motor coordination (d) were also monitored on days 7, 14, and 21 post the injection of paclitaxel. Mean ± SEM, n = 8 each group; **P < .01 vs. Vehicle group; ## P < .01 vs. paclitaxel group; repeated-measures ANOVA followed by LSD post hoc test. (e) The mRNA expression levels of Trpv1, Trpv4, Trpm8, and Trpa1 in DRG. Mean ± SEM, n = 8 each group; **P < .01 vs. Vehicle group. Unpaired Student’s t-test.
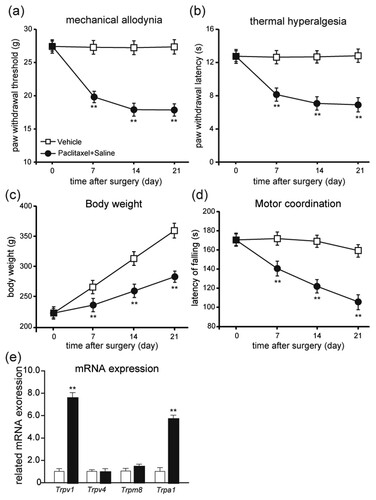
Figure 2. Amelioration of paclitaxel-induced mechanical allodynia and thermal hyperalgesia by consecutive injection of Res. Prevention of paclitaxel-induced mechanical allodynia (a) and thermal hyperalgesia (b) by repeated injection of Res. Res 100 or 200 mg/kg was injected (i.p.) during the induction of PIPNP. Paw withdrawal threshold in the von Frey test, number of responses in cold acetone test and paw licking latency in the hot-plate test were measured before and on days 7, 14 and 21 post the injection of oxaliplatin. Body weight (c) and motor coordination (d) were also monitored on days 7, 14 and 21 post the injection of paclitaxel. Mean ± SEM, n = 8 each group; **P < .01 vs. Vehicle group; ##P < .01 vs. paclitaxel + saline group; repeated-measures ANOVA followed by LSD post hoc test (n = 8–10 each group).
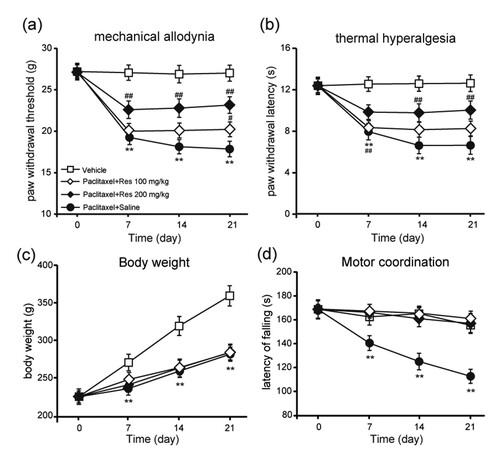
Figure 3. Effect of repeated Res injection on the mRNA expression of Trpv1 and Trpa1 in DRG. Effect of repeated Res (200 mg/kg) injection on the mRNA expression of TRPV1 (a) and TRPV4 (b) in DRG. Mean ± SEM, n = 8; **P < .01 vs. day 0; ##P < .01 vs. paclitaxel + saline; one-way analysis of variance followed by Fisher’s least significant difference post hoc test.
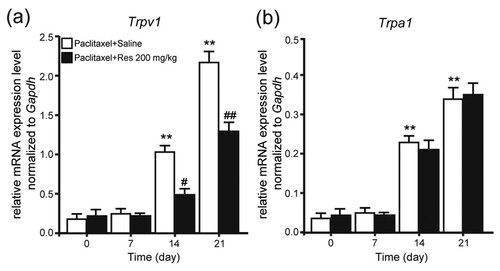
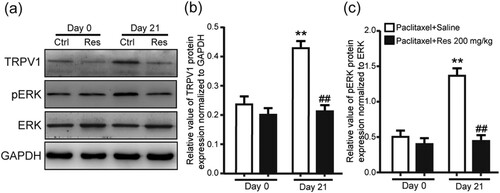
Figure 4. Protein expression of TRPV1 and pERK in DRG of PIPNP rats after consecutively Res treatment (a) Representative images of western blot result of TRPV1, phosphorylation of ERK (pERK), ERK, and GAPDH from DRG of PIPNP rats consecutively treated with Res (200 mg/kg). Comparison of TRPV1 (b) and pERK (c) protein levels in DRG of PIPNP rats consecutively treated with Res (i.p.). Mean ± SEM, n = 8, ** P < .01 vs. day 0, ##P < .01 vs. paclitaxel + saline group. One-way analysis of variance followed by Fisher’s least significant difference post hoc test.
Data availability statement
Due to the nature of this research, participants of this study did not agree for their data to be shared publicly, so supporting data are not available.