
Figures & data
Figure 1. X-ray irradiation induces ROS accumulation in TC cells. X-ray irradiation increased the percentage of DCF-positive SW579 cells (A and B), FTC-113 cells (D) and HeLa cells (E). All the cells were exposed to X-ray at the indicated dosages. Intracellular ROS levels were measured by FACS with DCF-DA staining at 24 h post-irradiation. (C) X-ray irradiation reduced SOD activity in SW579 cells, as indicated by quantification using the kit described in the Methods section. Relative activities are shown as mean ± SD (n = 3). *P < 0.05, **P < 0.01.
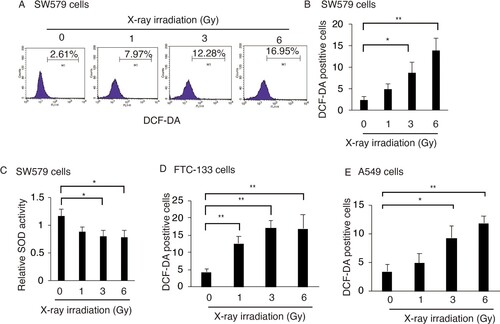
Figure 2. ROS exert protective effects in X-ray-irradiated TC cells. NAC and SOD reduced viability of X-ray-treated cells (A) and enhanced X-ray-induced apoptosis (B) in SW579 cells. (C) NAC reduced viability of X-ray-treated FTC-113 cells. SW579 or FTC-113cells were pretreated with NAC (5 mM) or SOD (500 U/mL) for 2 h and subsequently treated with 6 Gy X-ray. (A and C) Cell viability was analyzed at 24 h post-irradiation by MTT assay. (B) The percentage of apoptotic cells was measured by FACS with Annexin V and PI staining at 24 h post-irradiation. Annexin V-positive cells were considered as apoptotic. Results are expressed as mean ± SD (n = 3). *P < 0.05. (D) The levels of apoptosis-related proteins and P53 in SW579 cells after X-ray irradiation and NAC treatment were measured by western blot.
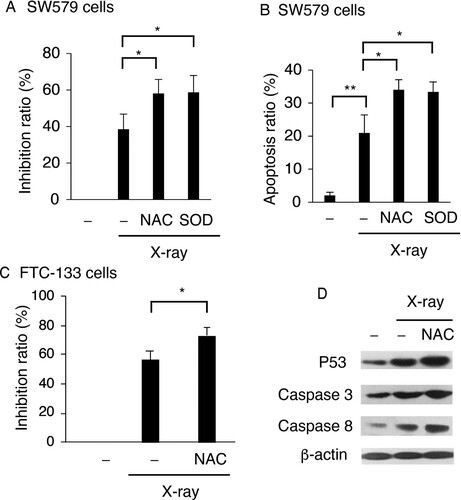
Figure 3. ROS promotes X-ray-induced autophagy in TC cells. NAC or SOD reduced X-ray-induced autophagy in SW579 cells (A) and FTC-113 cells (B), as measured by FACS with MDC staining. Results are expressed as mean ± SD (n = 3). *P < 0.05, ***P < 0.001. (C) NAC reduced X-ray-induced Beclin-1 expression in SW579 cells, as analyzed by western blot. (D) Autophagic vacuoles were visualized by MDC staining in SW579 cells at 24 h post-irradiation. Representative photos are shown.
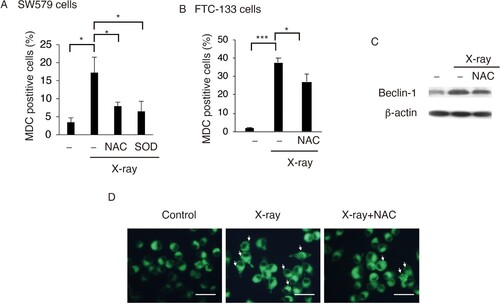
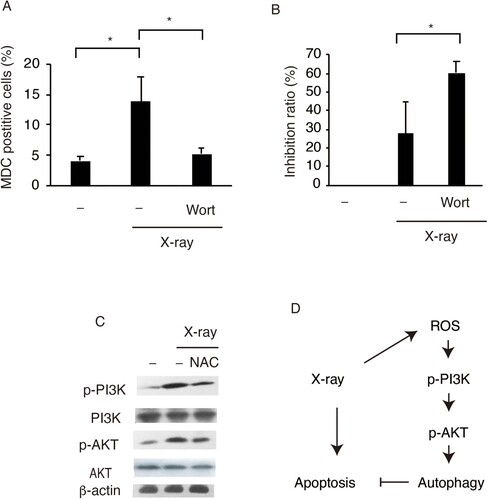
Figure 4. X-ray irradiation induces protective autophagy in SW579 cells via the PI3K-Akt pathway. X-ray induced (A) increases in autophagy and (B) decreases in cell viability via PI3 K in SW579 cells. SW579 cells were pretreated with 10 mM Wortmannin, a PI3 K inhibitor. Autophagy was measured by FACS, and cell viability was quantified by MTT assay at 24 h post-irradiation, and the cell inhibition ratio was calculated. Results are expressed as mean ± SD (n = 3). *P < 0.05. (C) Expression levels of proteins in the PI3K–Akt pathway in SW579 cells were analyzed by western blot. (D) X-ray induced protective autophagy via ROS accumulation and PI3K-Akt pathway activation in SW579 cells.
Data availability statement
Due to the nature of this research, participants of this study did not agree for their data to be shared publicly, so supporting data is not available.