
Figures & data
Figure 1. Gene enrichment analysis of differentially ARGs. (A) Heat map shows differentially expressed ARGs between CRC and non-tumor samples. (B) Box plot identifies 19 up-regulated genes and 18 down-regulated genes. (C) GO analysis shows the biological process, cellular component, and molecular function of differentially expressed ARGs. (D) KEGG analysis shows the signaling pathway involved in differentially expressed ARGs.
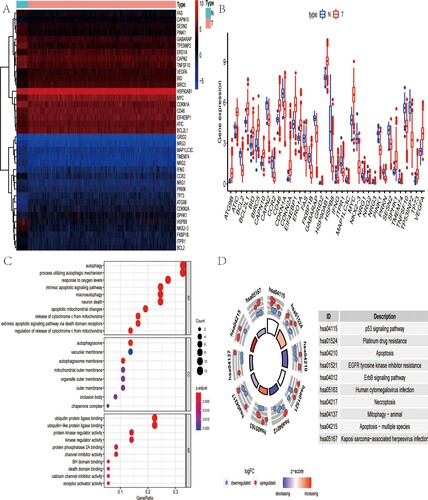
Figure 2. Genetic alteration of OS-related ARGs. (A) Forest plot shows 20 OS-related ARGs of TCGA-CRC cohort by univariate Cox regression analysis. (B) Top 5 ARGs with genetic mutation were WIPI2, ATIC, RAB7A, NRG1 and MAPK9, with mutation rate of 35, 16, 15, 14 and 12%, respectively.
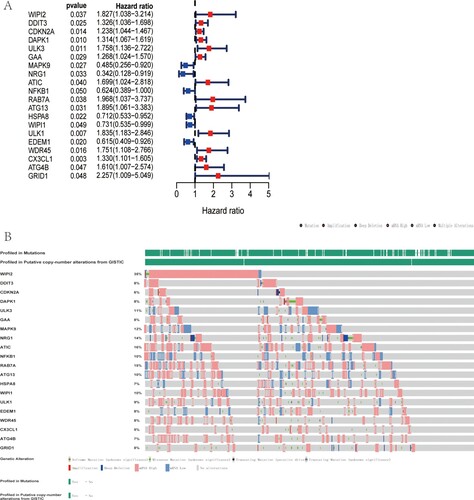
Figure 3. Characteristics of this autophagy-related gene signature. (A) Kaplan–Meier analysis reveals that patients in low-risk group have longer OS time than that in high-risk group. (B) Heatmap of the expression profile of prognosis-related ARGs. (C) Distribution of risk score of CRC patients and relationship between survival time and risk score. (D) The AUC for risk score is higher than other clinicopathological parameters, including TNM stage.
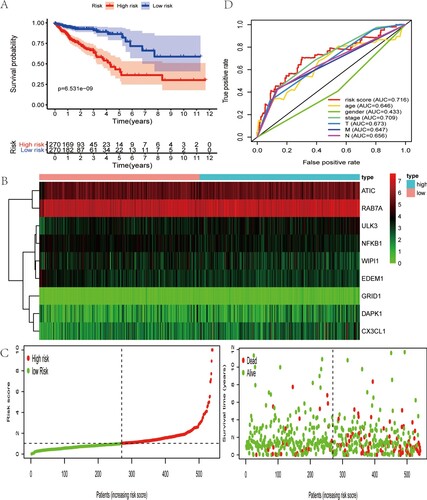
Figure 4. Predictive performance of this autophagy-related gene signature. A forest plot in univariate (A) and multivariate(B) Cox regression analysis shows that this expression signature could serve as an independent predictor for CRC prognosis.
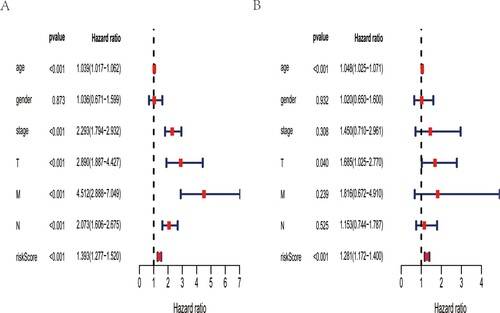
Figure 5. Clinicopathological significance of this autophagy-related gene signature in CRC. This risk score is positively related with tumor stage, tumor size, lymph node involvement and distant metastasis.
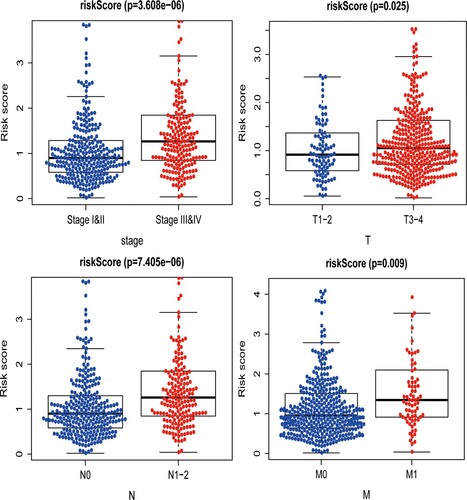
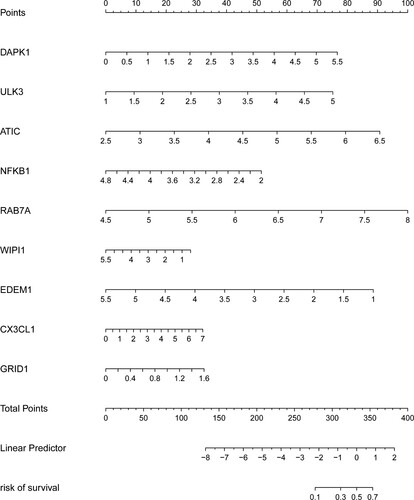
Figure 6. Development of a nomogram to predict the risk of OS in CRC.
Data Availability Statement
Data sharing is not applicable to this article as no new data were created or analyzed in this study.