
Figures & data
Figure 1. Comparative analysis of differentially expressed mRNAs in SARS-CoV-2 infected lung cells. A,B Venn analysis of all up/down expressed mRNAs among the four SARS-CoV-2 infection groups. a: Calu-3 infected with SARS-CoV-2 (doi:10.3390/biology9090260), b: ACE2-A549 infected with SARS-CoV-2 (GSE154613), c: Lung organoid model using human pluripotent stem cells infected with SARS-CoV-2 (GSE155241), d: Primary human bronchial epithelial cells infected with SARS-CoV-2 (GSE150819).
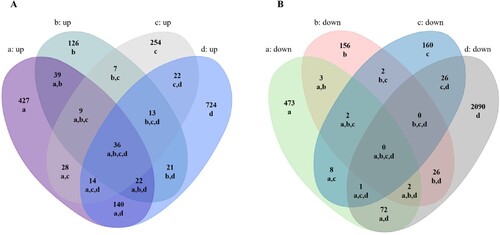
Figure 2. GO term enrichment analysis of SARS-CoV-2 induced up-regulated genes in all four groups. A, Number of enriched GO terms and KEGG pathways. B, Overview of significantly enriched biological processes, cell components, and molecular functions.
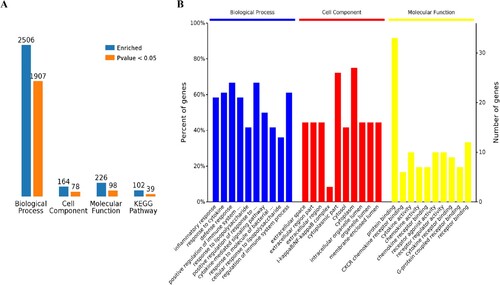
Figure 3. Analysis of 1907 biological process significantly enriched by all-up-regulated genes. A, Levels of enriched biological processes. B, Percent of genes associated with enriched biological processes. C, Top 10 of significantly enriched biological processes. D, Expressed genes associated with enriched biological processes. E, Pie chart of expressed proteins of enriched biological processes.
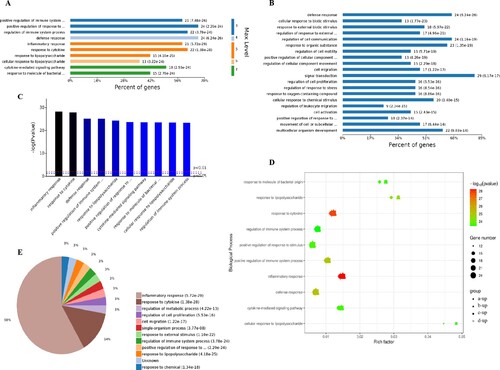
Figure 4. Analysis of 78 cell components significantly enriched by all up-regulated genes. A, Levels distribution of enriched cell components. B, Percent of genes associated with enriched cell components. C, Top 10 of significantly enriched cell components. D, Pie chart of expressed proteins of enriched cell components.
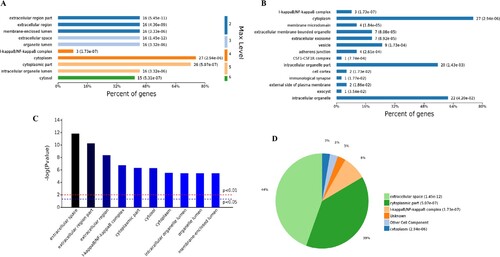
Figure 5. Analysis of 98 molecular function enriched by all up-regulated genes. A, Levels distribution of enriched molecular functions. B, Percent of genes associated with enriched molecular functions. C, Top 10 of significantly enriched molecular functions. D, Pie chart of expressed proteins of enriched molecular functions.
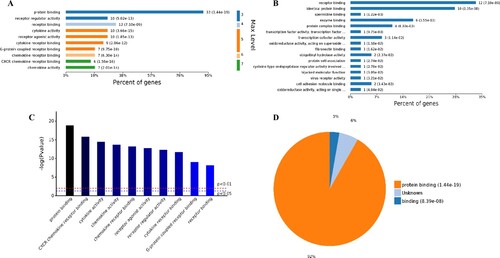
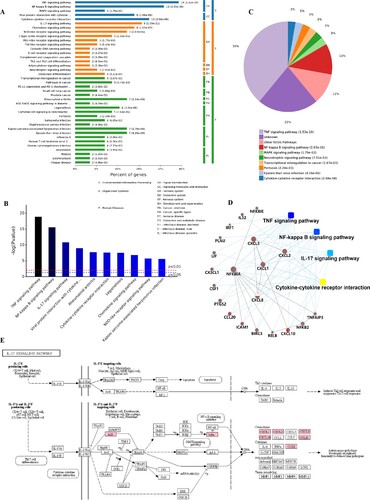
Figure 6. KEGG pathway cluster analysis and correlation analysis of all up-regulated genes. A, Percent of genes associated with enriched KEGG pathway. B, Distribution of enriched KEGG pathways. C, Pie chart of significant enriched KEGG pathway. D, Correlation analysis of up-regulated genes associated with key pathways. E, SARS-CoV-2 infection regulated the IL-17 signaling pathway. The key up-regulated factors are marked in red.
Supplemental Material
Download Zip (3.2 MB)Data availability statement
We searched for RNA-Seq experiments deposited in the Gene Expression Omnibus (GEO) database and NCBI PubMed related to SARS-CoV-2 infection in different types of human respiratory tract cells (Calu-3, doi:10.3390/biology9090260; ACE2-A549, GSE154613; a lung organoid model driving by human pluripotent stem cells, GSE155241; Primary human bronchial epithelial cells, GSE150819) which carried out in human cells (ex vivo) or human cell lines (in vitro).