Figures & data
Table 1. Primer sequences used in RT-qPCR assay.
Figure 1. Circ_0000518 is highly expressed in BC tissues and cell lines. (A) Volcano plots showed the differentially expressed circRNAs in BC samples (n = 8) and adjacent normal samples (n = 3). Red dots indicated the down-regulated circRNAs in BC tissues while the up-regulated circRNAs were shown in green dots. Differentially expressed circRNAs were screened out with |log2FoldChange| > 2 and P-value < 0.05 as the threshold value. GSE101123 was downloaded from the GEO database. (B) Heat map showed the top five up-regulated and down-regulated circRNAs in BC tissues (n = 8) compared with that in adjacent normal tissues (n = 3). (C) Circ_0000518 was derived the cyclization of exon 1 in RPPH1 gene, and its basic information was shown. (D) The expression of circ_0000518 was determined in 40 pairs of BC tissues and adjacent normal tissues via RT-qPCR. (E) The level of circ_0000518 was examined in MCF-10A and four BC cell lines by RT-qPCR. (F-I) The stabilities of circ_0000518 and RPPH1 mRNA were analyzed through using Oligo(dT)18 primers and RNase R. (J and K) The subcellular localization of circ_0000518 was assessed, and U6 and 18S rRNA were used as nuclear marker and cytoplasmic marker, respectively. *P < 0.05.
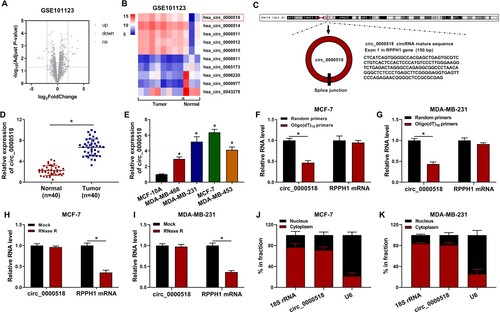
Figure 2. Circ_0000518 silencing suppresses the malignant phenotypes of BC cells. (A-I) MCF-7 and MDA-MB-231 cells were transfected with si-circ_0000518#1, si-circ_0000518#2 or si-NC. (A) The expression of circ_0000518 and RPPH1 mRNA was examined via RT-qPCR to assess the specificity of the two siRNAs. (B) MTT assay was performed to evaluate cell proliferation ability of BC cells. (C) Colony formation assay was conducted to analyze colony cell numbers after two-week incubation. (D) Flow cytometry was performed to analyze cell apoptosis rate. The apoptosis rate represented the percentages of BC cells with FITC+ and PI+/-. (E and F) Transwell assays were conducted to analyze the migration and invasion abilities of BC cells. (G and H) The production of lactate and the level of glucose in culture supernatant were assessed to analyze cell glycolytic rate. (I) Western blot assay was used to measure the protein expression of HK2 and PKM2 in BC cells. *P < 0.05.
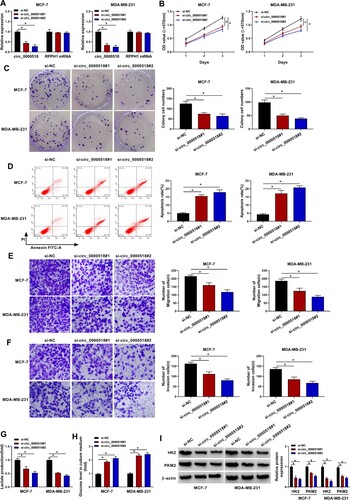
Figure 3. Circ_0000518 acts as a molecular sponge for miR-1258. (A) Prediction of the binding sites of miR-1258 in circ_0000518 by bioinformatic software Circinteractome. (B) The expression of miR-1258 in MCF-7 and MDA-MB-231 cells transfected with miR-NC or miR-1258 via RT-qPCR. (C and D) Dual-luciferase reporter assay was conducted to confirm the interaction between miR-1258 and circ_0000518 in BC cells. (E and F) RNA-pull down assay was performed to verify the target relationship between miR-1258 and circ_0000518. (G) The expression of miR-1258 in BC tissues (n = 40) and adjacent normal tissues (n = 40) was determined by RT-qPCR. (H) The level of miR-1258 in MCF-7, MDA-MB-231 and human normal mammary cell line MCF-10A was measured by RT-qPCR. (I) Linear correlation between miR-1258 and circ_0000518 was analyzed by Pearson correlation coefficient. (J) The level of miR-1258 was determined in MCF-7 and MDA-MB-231 cells transfected with si-NC or si-circ_0000518 by RT-qPCR. *P < 0.05.
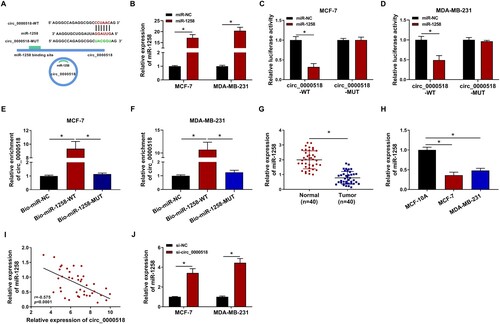
Figure 4. MiR-1258 silencing partly overturns circ_0000518 interference-mediated effects in BC cells. (A) The level of miR-1258 in MCF-7 and MDA-MB-231 cells transfected with anti-miR-NC or anti-miR-1258 was examined via RT-qPCR. (B-K) BC cells were transfected with si-NC, si-circ_0000518, si-circ_0000518 + anti-miR-NC or si-circ_0000518 + anti-miR-1258. (B-D) Cell proliferation ability was assessed by MTT assay and colony formation assay. (E) The apoptosis rate was analyzed by flow cytometry. (F and G) Transwell assays were conducted to measure the migration ability and invasion ability of BC cells. (H) The production of lactate was analyzed in transfected BC cells. (I) The level of glucose in the culture medium was assessed in four groups. (J and K) The protein expression of HK2 and PKM2 was measured by Western blot assay. *P < 0.05.
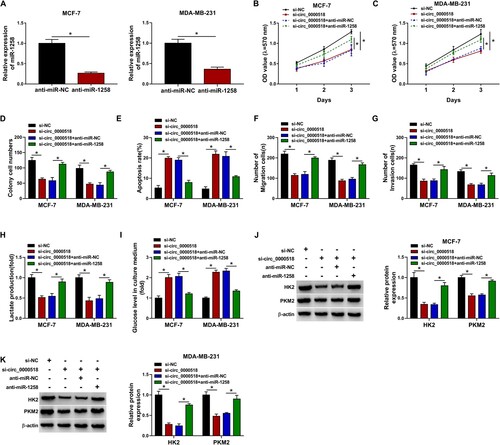
Figure 5. ZEB1 is a target of miR-1258 in BC cells. (A) The target relationship between miR-1258 and ZEB1 was predicted by miRmap database. (B and C) MCF-7 and MDA-MB-231 cells were transfected with luciferase plasmids and miR-NC or miR-1258, and luciferase activity was measured to assess if there existed target interaction between miR-1258 and ZEB1. (D and E) The influence of miR-1258 overexpression on ZEB1 level in BC cells was analyzed. The mRNA and protein expression of ZEB1 was examined in BC cells transfected with miR-NC or miR-1258. (F and G) The mRNA and protein levels of ZEB1 in BC tissues and adjacent normal tissues were measured by RT-qPCR and Western blot assay. (H and I) RT-qPCR and Western blot assay were implemented to examine the mRNA and protein expression of ZEB1. (J and K) BC cells were transfected with si-NC, si-circ_0000518, si-circ_0000518 + anti-miR-NC or si-circ_0000518 + anti-miR-1258. The mRNA and protein levels of ZEB1 in BC cells were measured by RT-qPCR and Western blot assay. (L and M) Pearson correlation coefficient was used to assess the linear correlation between ZEB1 and circ_0000518 or miR-1258. *P < 0.05.
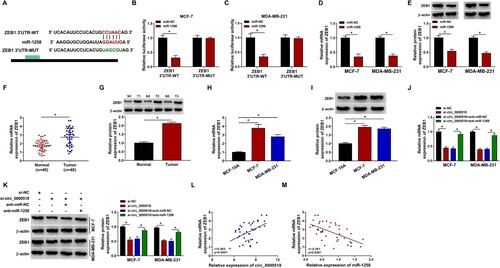
Figure 6. MiR-1258 overexpression-induced influences in BC cells are partly alleviated by the introduction of ZEB1 overexpression plasmid. (A and B) The mRNA and protein expression of ZEB1 was measured in BC cells transfected with pcDNA-NC or pcDNA-ZEB1 by RT-qPCR and Western blot assay. (C and D) Cell proliferation ability was analyzed by MTT assay. (E) Colony formation assay was performed to measure the proliferation capacity of BC cells. (F) The apoptosis rate was analyzed using flow cytometry. (G) Cell migration ability was measured by transwell migration assay. (H) Cell invasion was assessed using transwell invasion assay. (I and J) The production of lactate and the level of glucose in culture medium were measured to evaluate cellular glycolytic rate. (K and L) The expression of HK2 and PKM2 in BC cells was analyzed via Western blot assay. *P < 0.05.
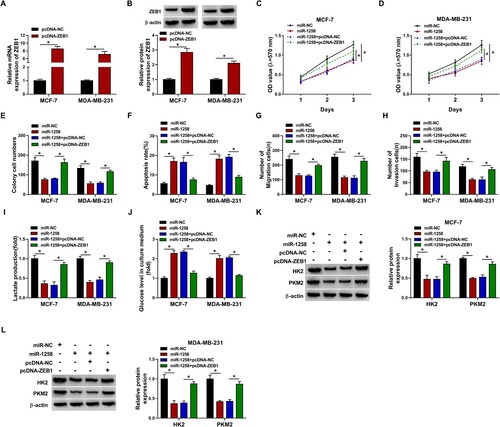
Figure 7. Circ_0000518 silencing suppresses BC progression in vivo. Xenograft tumor model was built using MCF-7 cells stably expressing sh-circ_0000518 or sh-NC. (A) Tumor volume was calculated every 3 d using the formula of width2 × length × 0.5, and tumor growth curve was then generated. (B) Tumors were resected and weighed after injection for 28 d. (C) RT-qPCR was applied to measure the expression of circ_0000518, miR-1258 and ZEB1 in resected tumor tissues. (D) Western blot assay was performed to analyze the protein level of ZEB1 in tumor tissues. *P < 0.05.
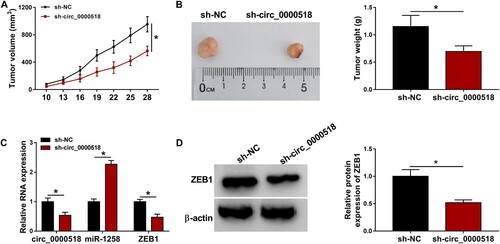
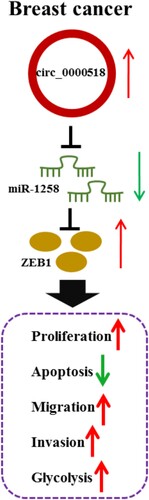
Figure 8. The diagram shows the role of circ_0000518/miR-1258/ZEB1 axis in BC progression.