
Figures & data
Figure 1. miR-33a-3p expression is downregulated in patients with pharyngeal cancer-induced dysphagia (PCD). (A) miR-33a-3p expression is downregulated in tumor tissues and adjacent healthy tissues in patients with PCD. (B) miR-33a-3p expression is downregulated in tumor cells and muscle satellite cells collected from patients with PCD, n = 10 for each group. **P < 0.01, n.s., not significant. One-way analysis of variance followed by Tukey’s multiple comparisons test. Error bars indicate SEM.
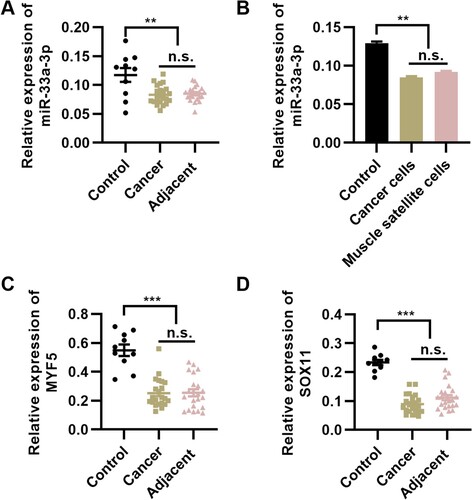
Figure 2. miR-33a-3p targets myf5 and sox11. (A-B) Bioinformatics prediction showed that miR-33a-3p may target myf5 and sox11; (C-D) The relative luciferase activity of the region in miR-33a-3p binding to the wild-type or mutant 3'-UTR of myf5 and sox11, n = 3 for each group; (E-H) myf5 expression is downregulated in muscle satellite cells (E-F) and sox11 expression is downregulated in tumor cells (G-H), n = 6 in each group; (I-J) Correlation between the expression level of miR-33a-3p and those of myf5 and sox11. **P < 0.01, ***P < 0.001, n.s., not significant. Mann–Whitney U test (C-G).
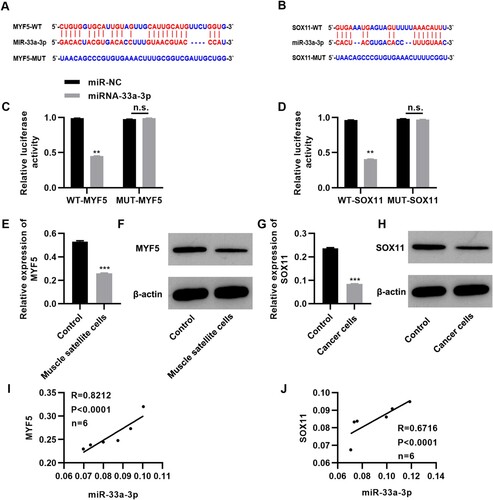
Figure 3. Tongguan Liyan Decoction promotes the proliferation and viability of muscle satellite cells (MSCs). (A-B) Tongguan Liyan Decoction enhances the proliferation and viability of MSCs. (C-G) RT-PCR and western blot analysis results show the expression profiles of miR-33a-3p (C), myf5 (D-E), and sox11 (F-G). (H) Tongguan Liyan Decoction did not alter the apoptosis of MSCs. n = 6 in each group. *P < 0.05, **P < 0.01, ***P < 0.001. n.s., not significant. One-way analysis of variance followed by Tukey’s multiple comparisons test (A-C, E, and G), and Mann–Whitney U test (H).
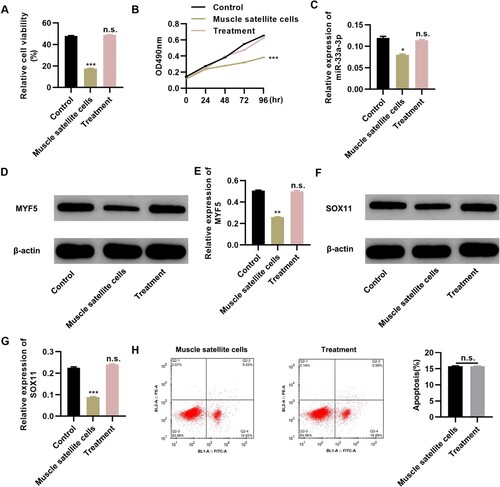
Figure 4. Tongguan Liyan Decoction inhibits the proliferation of tumor cells. (A-C) Tongguan Liyan Decoction represses the viability (A) and proliferation (B) of pharyngeal cancer cells, with increased apoptosis (C); (D-F) Tongguan Liyan Decoction upregulates the expression levels of miR-33a-3p (D), myf5 (E), and sox11 (F). n = 6 in each group. **P < 0.01, ***P < 0.001. n.s., not significant. One-way analysis of variance followed by Tukey’s multiple comparisons test.
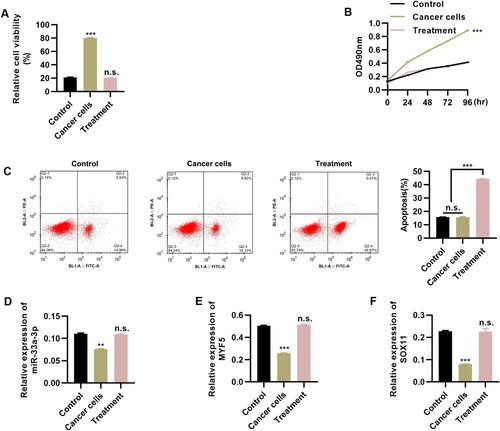
Figure 5. Regulation of myf5 and sox11 overexpression in in vitro cultured cells. (A-C) pcDNA3-FLAG3-myf5 plasmid upregulates myf5 expression, and myf5 overexpression promotes MSC viability (B) and proliferation (C). (D-E) sox11 overexpression decreases tumor cell proliferation (D) and viability (E). (F) pcDNA3.1-sox11 plasmid upregulates the expression level of sox11. n = 6 in each group. ***P < 0.001. n.s., not significant. Mann–Whitney U test.
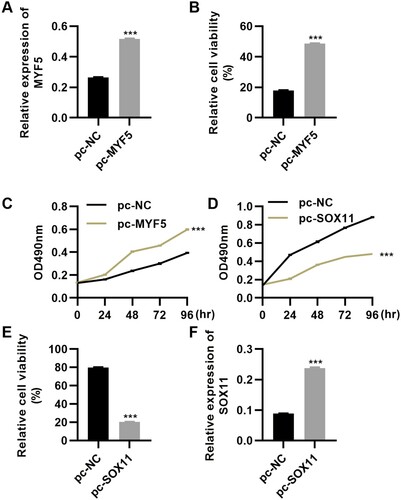
Figure 6. miR-33a-3p inhibitor reduced the viability of HSkMSCs and promoted the proliferation of NP69 cells. (A and B) miR-33a-3p inhibitor downregulated miR-33a-3p expression in HSkMSCs (A) and NP69 cells (B); (C-F) miR-33a-3p inhibitor downregulated the expression of myf5 and sox11 in HSkMSCs (C and E) and NP69 cells (D and F); (G-J) miR-33a-3p inhibitor inhibited the proliferative ability (G) and viability (I) of HSkMSCs and promoted the proliferative ability (H) and viability (J) of NP69 cells. Mann–Whitney U test.
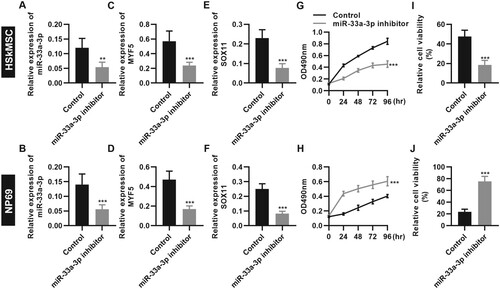
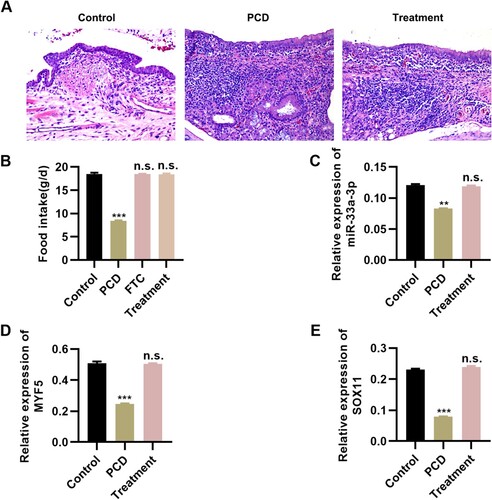
Figure 7. Tongguan Liyan Decoction ameliorated the pathological conditions of rat pharyngeal cancer-induced dysphagia (PCD) models. (A) HE staining results indicated that Tongguan Liyan Decoction improves the pathological conditions of pharyngeal tissues in PCD rats; (B) Tongguan Liyan Decoction increases the diet intake of PCD rats; (C-E) Tongguan Liyan Decoction upregulates the expression of miR-33a-3p (C), myf5 (D), and sox11 (E) in PCD rats. n = 6 in each group. **P < 0.01, ***P < 0.001. n.s., not significant. One-way analysis of variance followed by Tukey’s multiple comparison test (B-E).
Data availability statement
Due to the nature of this research, the participants of this study did not agree to their data being shared publicly, so supporting data is not available.