
Figures & data
Figure 1. The expression of HER-2 protein in five gastric cancer cell lines. (A)Western blotting was used to detect HER2 protein expression. (B) The densitometric quantification of HER2 normalized over GAPDH from all cell lines.
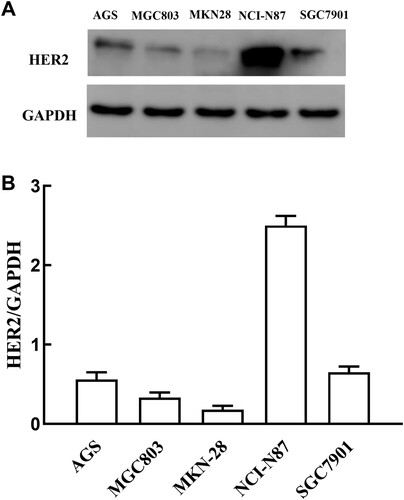
Figure 2. Growth inhibitory effects of trastuzumab alone in gastric cancer lines. The in vitro MTT assay after 1 d of exposure to trastuzumab at various concentrations (1 mg/l, 10 mg/l, 100 mg/l, and 1000 mg/l).
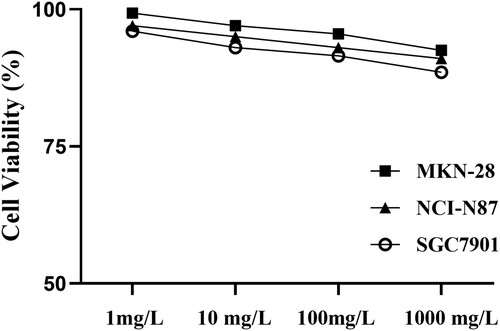
Table 1. IC50 values of the four chemotherapy drugs in gastric cell lines.
Figure 3. Growth inhibitory effects of trastuzumab (100 mg/l) in combination with four chemotherapeutic drugs at IC50 for 1 d in the MKN-28, NCI-N87 and SGC7901 gastric cancer lines. (A): White column chart: cisplatin; black column chart: combination of trastuzumab and cisplatin; (B): white column chart: 5-Fu; black column chart: combination of trastuzumab and 5-Fu; (C) white column chart: docetaxel; black column chart: combination of trastuzumab and docetaxel; (D) white column chart: epirubicin; black column chart: combination of trastuzumab and epirubicin. Data points: mean values ± SD of the cell inhibition rate (%). Statistical analysis: Statistically significant differences between the two groups are shown with an asterisk (∗p < 0.05).
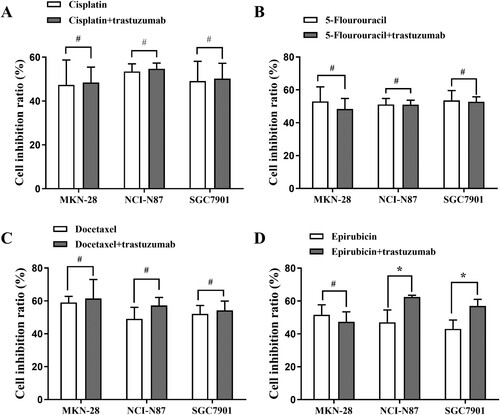
Figure 4. Protein levels of pAkt and Akt in the NCI-N87, MKN-28 and SGC7901 cell lines at 24 h after treatment. Every cell line was divided into four groups: (1) control group, (2) epirubicin group, (3) trastuzumab group, (4) trastuzumab+ epirubicin group. (A) Western blot assay of pAkt and Akt in the NCI-N87 cell line. The bar graph reflects the pAkt (B) and Akt (C) levels in the NCI-N87 cell line. (D) Western blot assay of pAkt and Akt in the MKN-28 cell line. The bar graph reflects the pAkt (E) and Akt (F) levels in the MKN-28 cell line. (G) Western blot assay of pAkt and Akt in the SGC7901 cell line. The bar graph reflects the pAkt (H) and Akt (I) levels in the SGC7901 cell line. Statistically significant differences between the two groups are shown with an asterisk (∗p < 0.05).
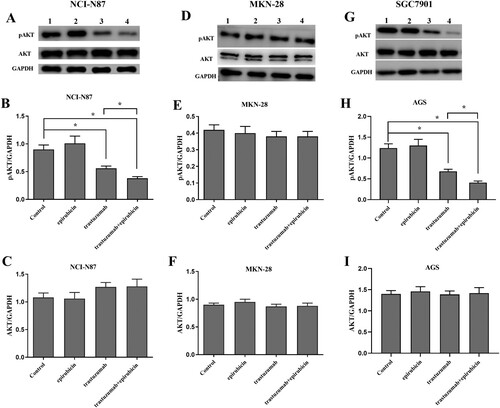
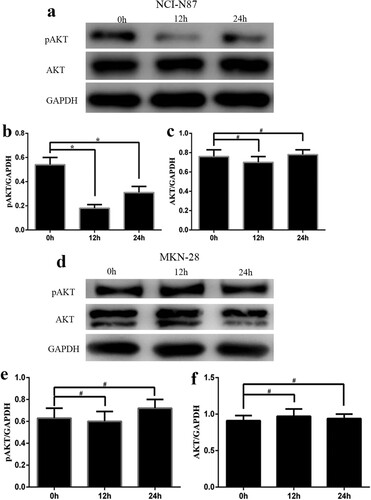
Figure 5. Protein levels of pAkt and Akt in the NCI-N87 and MKN-28 cell lines after treatment with trastuzumab and epirubicin at 3 time points (0, 12, and 24 h). (a) Western blot assay of pAkt and Akt in the NCI-N87 cell line. The bar graph reflects the levels of pAkt (b) and Akt (c) in the NCI-N87 cell line. (d) Western blot assay of pAkt and Akt in the MKN-28 cell line. The bar graph reflects the levels of pAkt (e) and Akt (f) in the MKN-28 cell line. Statistically significant differences between the two groups are shown with an asterisk (∗p < 0.05).
Data availability statement
Due to the nature of this research, participants of this study did not agree for their data to be shared publicly, so supporting data is not available.