
Figures & data
Figure 1. Preparation of feces and intraperitoneal stool injection (IPSI). For a detailed description of the methodology please refer to the methods section. PBS = Phosphate-buffered solution, RT = room temperature.
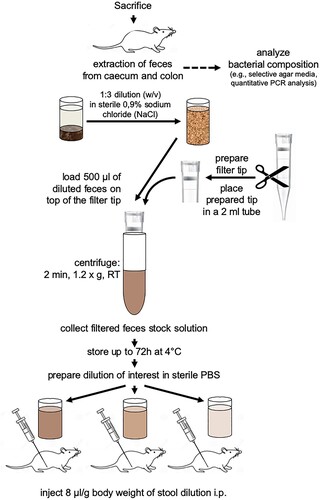
Table 1. Clinical score sheet for the evaluation of disease level in mice.
Figure 2. Quantity of selected bacteria in mouse feces. Bacterial quantity was estimated by streak plate on ChromAgar orientation plates. Freshly isolated feces from 20 single mice were plated on ChromAgar orientation plates and incubated for 48 h at 37°C. Quantity of indicated bacteria was deduced from appearance of colonies only in the first streak (1 = low bacterial growth), first and second streak (2 = medium bacterial growth), and first to third streak (3 = high bacterial growth). Mean + SD (n = 20). KEEC group subsume Enterococci, Klebsiella, Enterobacter and Citrobacter.
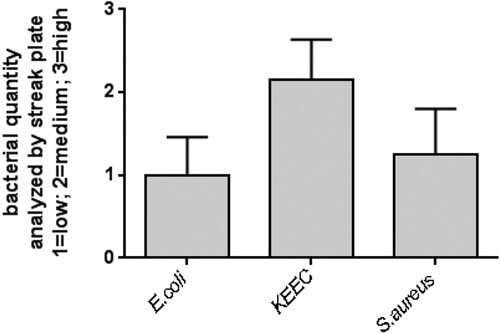
Figure 3. Influence of different storage conditions on the viability of selected bacteria. (A) E. coli; (B) bacteria from the KEEC group (subsume Enterococci, Klebsiella, Enterobacter and Citrobacter); (C) S. aureus. Feces were isolated, initially diluted 1:3 with sterile 0.9% sodium chloride (NaCl), filtered as described, and subsequently, stock solution samples were stored for 72 h under the indicated conditions. Viability is given in % of bacterial viability observed in freshly isolated feces. Mean + SD (n = 6–8), p < 0.05 vs. freshly isolated feces (two-sided, unpaired Student’s t-test).
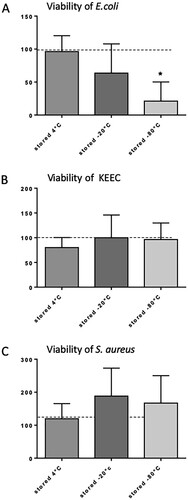
Figure 4. Intraperitoneal feces injection dose-dependently influence the development of sepsis symptoms. Filtered stock solution feces were diluted 1:3; 1:6, and 1:9 with sterile PBS and injected intraperitoneally. Sham animals received an equal volume of PBS, control animals were not injected. Body weight and temperature were recorded 18 h after injection, clinical scores were recorded at the indicated time points (hours after feces injection, given on the X axis of panel C). (A) body weight in % of initial body weight; (B) temperature; (C) clinical scores. Mean + SD (n = 16–24 animals per group), p < 0.001 (ANOVA, Dunnett’s multiple comparison test (A;B), Tukey’s multiple comparison test (C)).
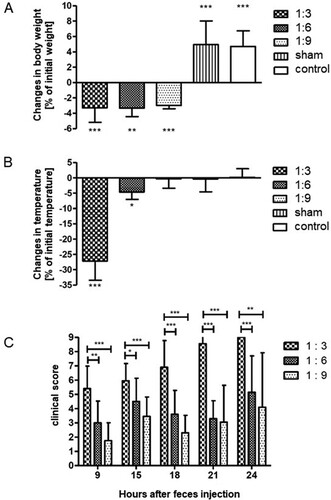
Figure 5. Influence of intraperitoneal feces injection on the expression levels of the pro-inflammatory cytokine IL-6 and chemokine CCL2 in the murine spleen. 9 h after feces injection, animals were sacrificed, spleens were removed, snap frozen in liquid nitrogen, and stored at −80°C until further use. Total RNA was extracted, reverse transcribed into cDNA, and the mRNA levels of IL-6 and CCL2 were quantified by real-time PCR. Target gene expression was normalized to expression of 18s RNA, and induction of target genes was calculated using the 2-ΔΔCT method. All treatment groups were significantly different from control and sham groups, differences between the feces dilutions used were significant when indicated. The graphs compare the expression of genes of interest in the treatment groups relative to the control (fold changes). Mean + SD (n = 4 −8 animals per group), p < 0.05 (ANOVA, Tukey multiple comparisons-test).
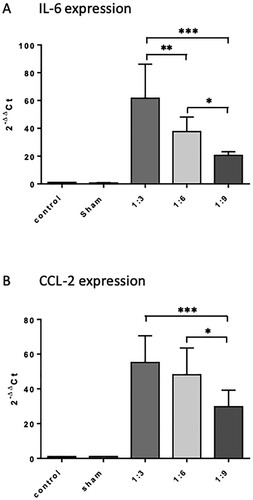
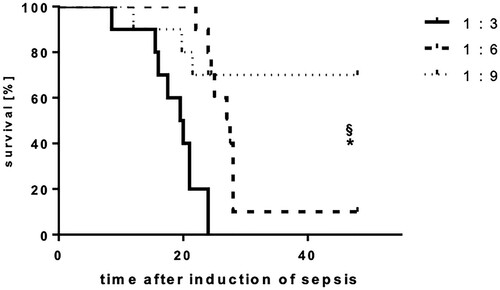
Figure 6. Intraperitoneal feces injection dose-dependently influence the lethality of mice. Mice were subjected to IPSI, and survival was assessed up to 48 h. Mean (n = 12 animals per group), p < 0.05 (Student’s unpaired T-test). * indicates significant improvement of survival in comparison to the 1:3 group, § indicates significant improvement of survival in comparison to the 1:6 group.
Data availability statement
Data sharing is not applicable to this article as no new data were created or analyzed in this study.